
KCJ ORIGINAL CONTRIBUTION
What morphology can teach us about renal cell carcinoma clonal evolution
Departments of ¹Pathology, ²Lyda Hill Department of Bioinformatics, ³Urology, ⁴Internal Medicine, Hematology-Oncology Division, ⁵Kidney Cancer Program, Simmons Comprehensive Cancer Center, University of Texas Southwestern Medical Center, Dallas, TX 75390.ABSTRACT
While cancer is a clonal process, cumulative evidence suggest that tumors are rather heterogenous and are composed of multiple genetically-distinct subclones that arise at different times and either persist and co-exist, expand and evolve, or are eliminated. A paradigm of tumor heterogeneity is renal cell carcinoma (RCC). By exploiting morphological traits and building upon a framework around three axes (architecture, cytology and the microenvironment), we review recent advances in our understanding of RCC evolution leading to an integrated molecular genetic and morphologic evolutionary model with both prognostic and therapeutic implications. The ability to predict cancer evolution may have profound implications for clinical care and is central to oncology.
INTRODUCTION
Metastasis is a complex process wherein tumor cells evade immune surveillance, dislodge from primary tumors, invade a vascular/lymphatic conduit, and disseminate to secondary sites to form new masses. Each step involves a selection process between the tumor cells and the host. Fundamental to this process (and not much dissimilar to evolution across species), is the plasticity of tumor cells and their diversity, which increases their fitness. Multiregion genomic sampling analyses have shown that tumors evolve from an ancient clone that over time evolves into multiple genetically-distinct subclones and acquire metastatic competency. Dissemination to metastatic sites may be an early or late event. This intra-tumoral heterogeneity poses a significant problem for cancer management. Focusing on renal cell carcinoma (RCC), the prototypical model of tumor heterogeneity, we discuss its implications.
RCC of clear cell type: not a single disease
Clear cell RCC (ccRCC) accounts for over 70% of all RCC. Like many cancers, ccRCC has significant variability. Small ccRCCs (less than 4 cm in size) exhibit a relatively indolent behavior, however, a small subset of these tumors are aggressive1. Surgery is the treatment of choice for localized or locoregional disease (stage I-III). Up to 25% of patients with apparently localized ccRCC relapse after surgery2. Fifteen percent of patients present with metastatic disease, and up until recently, metastatic RCC was largely incurable. The 5-year survival rate for patients with metastatic RCC is ~10%,though more durable responses have been recently observed in patients receiving combination immunotherapy3-5.
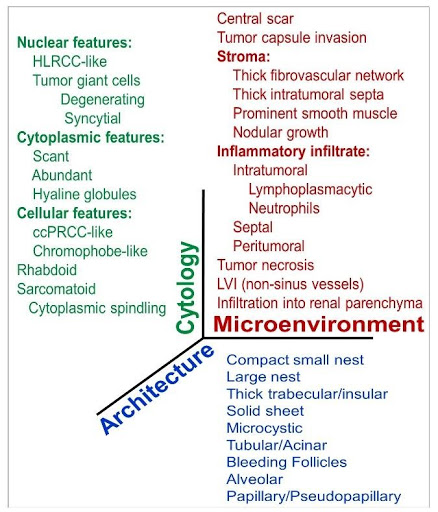 Fig. 1 | A multiscale framework to dissect ccRCC heterogeneity according to three fundamental axes: tumor cytology, architecture and the microenvironment. 33 different parameters were evaluated in 549 ccRCCs (Cai et al., EBioMedicine 2020).
ccRCC can spread through both lymphatics and hematogenously, and is remarkably predisposed to intravascular growth. It can colonize at a wide range of secondary distant sites. Intriguingly, the site of metastasis may confer variable prognosis; liver metastasis is associated with a worse prognosis, while pancreatic metastasis has good prognosis6-9. Additionally, the metastatic course may be variable, both in terms of spatial and temporal patterns. Metastases may be solitary or oligometastatic with long latency periods or associated with rapid multiorgan dissemination. Isolated metastases can be managed with focal therapies (surgery, ablation or stereotactic radiation) or by active surveillance10,11.
Disseminated metastatic ccRCC requires systemic therapy including inhibitors of the vascular endothelial growth factor (VEGF)/ VEGF receptor (VEGF/R-I) and mammalian target of rapamycin (mTOR) inhibitors. These have variable responses and are largely palliative2. More recently, immune checkpoint inhibitors (ICIs) of the PD-1 and CTLA-4 pathways have been approved by the FDA4,5. In 2020, frontline systemic treatment is defined by immune checkpoint inhibitor (ICI) combination therapies such as ICI doublets (ipilimumab and nivolumab) or ICI with targeted therapies (pembrolizumab or avelumab with axitinib)4,12,13. Even with these combinations, over 50% of patients experience progressive disease. Multiple other therapeutic options are investigated ranging from targeted therapies such as HIF-2 inhibitors, inhibitors of metabolism (e.g. glutaminase inhibitors), and a plethora of immunotherapies.
Despite substantial progress and a broad spectrum of systemic therapies, precision medicine and biomarker development have lagged behind. The success and optimal utilization of treatment options will depend on our understanding of tumor biology as well as intratumoral heterogeneity (ITH). In summary, the wide clinical course of ccRCC patients may reflect the underlying intra-tumor and inter-patient heterogeneity. Precision medicine will benefit from better understanding of the tumor evolution and ITH.
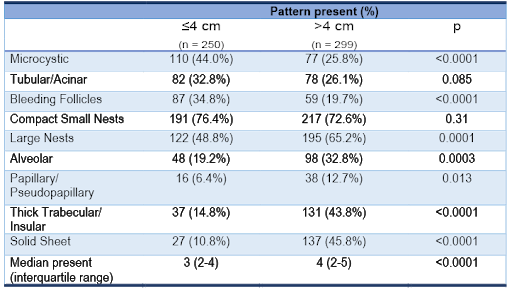 Table 1 | Clear cell renal cell carcinoma tumor size and frequency of architectural features (as patterns co-occur, the composite frequencies exceed 100%).
Clear cell RCC, a prototype of genomic intra-tumoral heterogeneity
The wide spectrum of clinical behavior and variable response to therapy is mirrored at the molecular level by inter- and intra-tumoral heterogeneity14-16. Molecularly, ccRCC is quite intriguing, as genes that are frequently mutated in other common tumor types are rarely mutated in ccRCC17. Converesely, frequently mutated genes in ccRCC are rarely mutated in other tumors. Sporadic ccRCC is characterized by VHL mutation (or methylation) in >80% of tumors, and loss of heterozygosity of 3p (where VHL resides) in ~90% of cases18,19
ccRCC has long been considered the archetype for genomic ITH starting with the seminal publication by Gerlinger and colleagues demonstrating the value of multi-region sequencing in understanding cancer evolution20. More recently, multiregional sequencing experiments have been performed on a much larger scale, including 1,206 spatially-distinct primary tumor areas from 101 RCC patients profiled by the TRAcking Cancer Evolution through therapy (Rx) (TRACERx) consortium. These studies have provided unprecedented detail on ITH and showed that as tumor cells proliferate, spatial and temporal subclones with different mutations and somatic copy number alterations (SCNA) evolve and co-exist in different areas. Other than VHL and PBRM1, driver mutations in SETD2, BAP1, KDM5C, MTOR, PIK3CA, PTEN, p53, and KDM6A are frequently found at a subclonal level16,18. Based on patterns of tumor evolution and inferred mutation timing, ~60% of ccRCC (64/101) can be grouped into seven evolutionary subtypes16. “VHL monodriver” tumors are characterized by low grade, low stage, indolent behavior and minimum ITH. In contrast, tumors that are characterized by high grade and rapid progression to metastases include 3 subtypes: “BAP1 driven,” “VHL wild-type,” and “multiple clonal drivers.” The “BAP1 driven” evolutionary subtype is characterized by truncal VHL and BAP1 mutations; and no VHL alteration was detected in the “VHL wild-type” evolutionary subtype. The “multiple clonal drivers” exhibited truncal aberrations in two or more of the following genes: BAP1, PBRM1, SETD2, or PTEN. Tumors with intermediate aggressiveness were characterized by low-intermediate grade, increased ITH, parallel evolution, and attenuated disease progression. Three PBRM1-driven subtypes were noted in this group, which had sequential loss of PBRM1 followed by loss of SETD2, activation of PI3K/ AKT/ mTOR signaling pathway, or specific SCNAs.
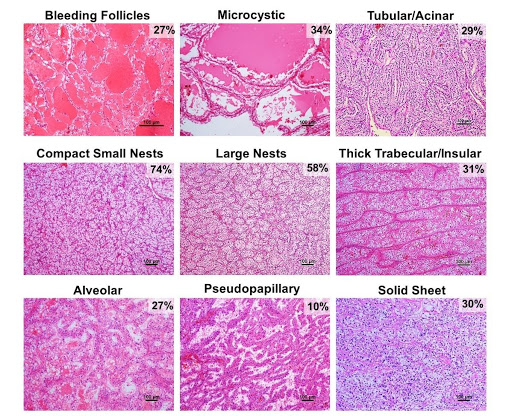 Fig.2 | Architectural patterns of ccRCC. Nine architectural patterns with representative H&E-stained images and their frequency in ccRCC. As patterns co-occur in tumors, the composite frequencies exceed 100% (For more details, Cai et al.., EBioMedicine 2020).
These results support findings from a prior single sample sequencing study that led us to propose an integrated molecular genetics and pathological classification of sporadic ccRCC15. We discovered that mutations in BAP1 tend to anticorrelate with mutations in PBRM1, while PBRM1 and SETD2 often co-occur15, 21,22. BAP1-mutant tumors tend to be of high grade and are associated with worse survival (HR, 2.7; p=0.044), compared to PBRM1-mutant tumors that are typically of low grade and associated with better outcomes although when SETD2 is also mutated, PBRM1-mutant tumors are more aggressive15, 21-25.
In the TRACERx study, decreasing ITH correlated with an aggressive disease course, suggesting that a competent, aggressive clone may outgrow co-existing clones. Reduced ITH of these tumors may make them potentially more vulnerable to therapy. On the other hand, tumors with high degree of ITH comprising diverse subpopulations of cancer cells, may be more likely to have a mixed response to therapy, unless a truncal event is targeted.
Capturing the full degree of ITH is challenging. It has been proposed that at least 7 biopsies are required to detect over 75% of variants16. An alternative might be representative sequencing (Rep-Seq). By homogenizing larger quantities of tumor material, Rep-Seq may accurately deconvolute clonal structures26. However, these tools are subject to sampling bias and are expensive. Nevertheless, what is clear is that accurate prognostic and predictive models will likely need to address ITH to faithfully predict tumor behavior.
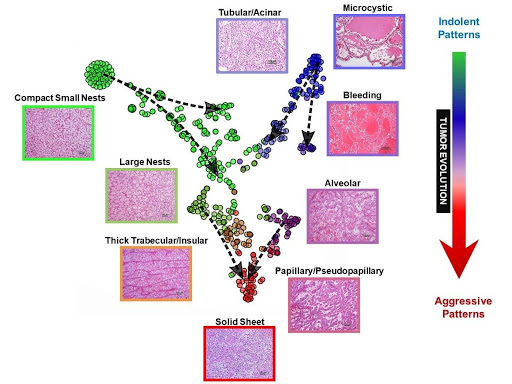 Fig. 3 | Map of ccRCC architectures and evolutionary model. t-distributed stochastic neighbor embedding (t-SNE) map of primary ccRCC tumors based on architectural composition with superimposed vectors using pure patterns as anchors and overlaying tumor size and grade for directionality (dashed arrows).
Morphologic intra-tumoral heterogeneity
The ITH so elegantly highlighted with molecular tools has been appreciated for decades by pathologists27-29. Indeed, categorization of new entities often starts with recognition of different morphologic patterns and these entities are subsequently determined to have divergent genomics, biology and behavior (e.g. clear cell papillary RCC). In addition, histopathologic analyses are the current standard of care for routine diagnosis and prognosis of RCC (and cancer in general). Currently ccRCC grading is largely based on morphologic assessment of nucleolar size. More recently, differentiation patterns like sarcomatoid and rhabdoid have been shown to impact prognosis and may even be predictive. This implies that morphology can capture tumor aggressiveness. However, multiregional molecular genetic studies have largely been performed agnostic to morphology. A contributing factor may be that molecular genetic analyses are optimally performed from frozen tissues while morphology is routinely assessed on formalin fixed tissue.
Morphology, a phenotypic reflection of the underlying genome and transcriptome, not only allows for interrogating molecular data at a phenotypic level but also provides clues about tumor–environment interactions. The tumor interaction with its microenvironment is important, and it is noteworthy that most FDA-approved therapies today do not target cancer cell themselves, but rather target host cells either in the vasculature or of the immune system. In addition, morphology may be useful proxy to evaluate the effects of genomic alterations and may shed light on genomic evolutionary subtypes and their therapeutic vulnerabilities. However, up until recently, the significance of these different morphological phenotypes has remained unexplored. Recently, our multidisciplinary team sought to systematically dissect and comprehensively explore the implications of ccRCC phenotypes. Our goals were: (1) to devise a framework to deconvolute the phenotypic complexity of ccRCC; (2) to establish an ontological classification capturing the breadth of ccRCC phenotypes; (3) to explore the biological and clinical implications of subtypes identified; (4) to develop an evolutionary model of tissue phenotypes; and (5) to expand the approach by objectivizing it using digital pathology30. Unlike prior morphologically-based cataloguing efforts29, we did not focus on high-grade areas alone, but sought instead to evaluate representative areas of the entire tumor so as to infer the phenotypic evolutionary process.
We developed a multiscale atlas based on three fundamental axes: tumor cytology, architecture and the microenvironment (Figure 1). We defined 9 distinct architectural and 24 unique cytologic and tumor microenvironment (TME) features (Figure 2). We systematically applied this framework assessing the frequency of these individual features across 549 ccRCCs. The analysis was carried out by two pathologists independently. While they both trained at the same institution, the concordance rate was 95%30. This study sets a paradigm for de-convoluting phenotypic complexity and established a comprehensive morphologic ontology of ccRCC.
Widespread intra-tumoral architectural heterogeneity
Similar to genomic studies, a large number of spatially distinct morphologic architectural phenotypes/ patterns are observed in ccRCCs. More than 85% (476/549) of the tumors in our study had multiple patterns with an average of 3 architectures per tumor (std. dev., 1.4; range, 1-7 patterns/tumor)30. In addition, widespread variability in the tumor microenvironment and cytologic heterogeneity was also observed. At times, different cytologic features were observed within the same architectural pattern. Conversely, similar cytologic features were observed across different architectural patterns.
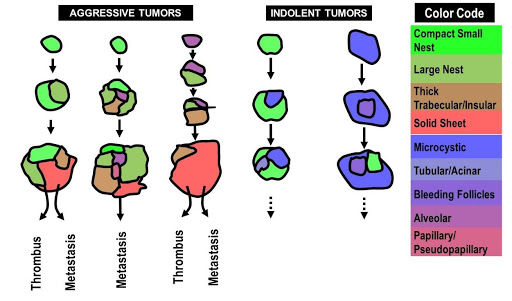 Fig. 4 | Architectural evolutionary model. Color-coded cartoon to show the broad directionality of the architectural evolution likely influencing future tumor behavior.
Smaller tumors were generally characterized by reduced architectural diversity than larger ones (p < 0.0001), suggesting that morphological heterogeneity reflected tumor plasticity over time. The most common architecture in small tumors was compact small nests. In contrast, large tumors where characterized by thick trabecular/insular and solid sheet patterns (Table 1). Tumors with high morphological ITH were associated with features of aggressive biology including high nucleolar grade, high TNM stage, and metastasis (all p < 0.0001). Overall, these patterns of morphologic ITH show similar trends as those of genetic ITH reported with multiregional sequencin16.
Phenotypic patterns illustrate tumor aggressiveness and predict patient outcomes
To determine the clinical significance of each unique phenotype, we sought to quantify their relationship with known clinical parameters. In doing so, we wanted to go beyond the traditional paradigm of ccRCC behavior being predicted solely by its most aggressive area/subclone and explore how individual components contributed to the outcome. This required a comprehensive pattern assessment within a tumor. Chi-square analyses of individual patterns with clinical parameters revealed a subset of architectural, cytologic, and TME features (irrespective of their extent or the presence of other features) that were informative of tumor aggressiveness and were significantly associated with high nucleolar grade, TNM stage, and metastases30. Architectures could be broadly categorized into indolent (microcystic, tubular/acinar, bleeding follicle, and compact small nests) and aggressive (alveolar, papillary/ pseudopapillary, thick trabecular/insular, and solid sheet). Certain features such as infiltration into the renal parenchyma, a feature not currently considered for RCC staging, was prognostic even if found in isolation30. Morphologic patterns correlated with tumor grade, and subgroup analyses showed that while aggressive patterns were observed more frequently in tumors of higher grade/ stage, grade alone underestimated the aggressiveness of some low-grade ccRCCs. After controlling for conventional variables such as nucleolar grade and sarcomatoid/rhabdoid patterns in multivariate analysis, the presence of a subset of features (tubular/acinar pattern, chromophobe RCC (ChRCC)-like pattern, infiltration into the renal parenchyma, and necrosis) was predictive of disease-free survival (DFS)30. These data suggest that architecture, cytologic and TME features may help refine current prognostic algorithms.
Leveraging spatial relationships of architectural patterns to identify recurrent evolutionary trajectories
One advantage of morphological analyses over random sampling genomic studies is visualization of the spatial relationship of the different architectures within a tumor. Clonal evolution is thought to result from the interplay of random mutations (and possibly epigenetic changes) and non-random selection. In spite of the presumed random nature, lineage constraints and the microenvironment may influence evolutionary trajectories. Accordingly, conditioned by the presence of a specific mutation or characteristic microenvironment, additional mutations may vary greatly in their fitness impact and thus their likelihood of fixation. This may explain, for example, the low frequency of tumors with simultaneous mutations in BAP1 and PBRM1.
Like the TRACERx studies, our results represent a snapshot of a single time point in the evolutionary history of a tumor. To infer tumor evolution, we made the following assumptions. First, larger tumors arise from smaller tumors and their patterns likely emerge from those present in smaller tumors. Second, higher grade tumors are unlikely to evolve into lower grade tumors, but lower grade tumors may evolve to higher grade. Third, co-existing architectures likely evolve from one another or a common precursor. Fourth, while analyses of particular tumors provide snapshots, trends in the evolutionary process may be inferred from the collective analysis of tumors in (presumably) different stages of evolution.
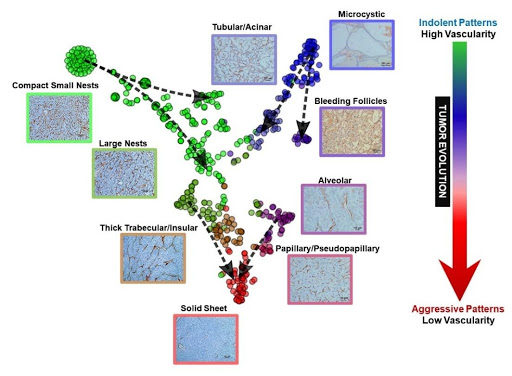 Fig. 5 | Vascular framework as highlighted by CD31 immunohistochemical labeling in ccRCC architectures and evolutionary model. Representative CD31 IHCs from primary ccRCC tumors based on architectural pattern. The vascular network becomes more spaced out as the tumor evolves from indolent to more advanced patterns.
The most common architectural pattern was compact small nests, prevalent in ~75% of the tumors in varying amounts. The compact small nest pattern was consistently associated with low nuclear grade, and was the only pattern seen in some small ccRCCs (of the 73 tumors with a single pattern, 78% were comprised solely of compact small nests), suggesting that it may be a truncal pattern. In a subset of ccRCCs, spatially separate subclones with more aggressive architectures were present sometimes giving the appearance of an overgrowth pushing the compact small nest pattern to the periphery. The more aggressive architectural patterns were often spatially adjacent to the more indolent patterns, suggesting that they arose from the more indolent pattern. The transition to distinct subclones was either gradual with progressive changes in nuclear features, or abrupt with strikingly higher-grade nuclei and distinctly different architectural phenotypes. In a subset of single-pattern tumors (8%; 6/73) a more aggressive pattern made up the entire tumor and these tumors were uniformly large (mean size, 9.5 cm) and of high grade.
The compact small nest pattern is the prototype of ccRCC. In routine clinical practice, the presence of compact small nests, even when restricted to a small area, is used to characterize RCC as ccRCC. This pattern closely resembles the low-grade tumors observed in genetically engineered mouse models with loss of Vhl and Pbrm131-33. Consistent with this notion, human ccRCCs with compact small nests show diffuse membranous carbonic anhydrase (CAIX) expression, a downstream effect of VHL loss, and a large subset show PBRM1 loss by immunohistochemistry (IHC).
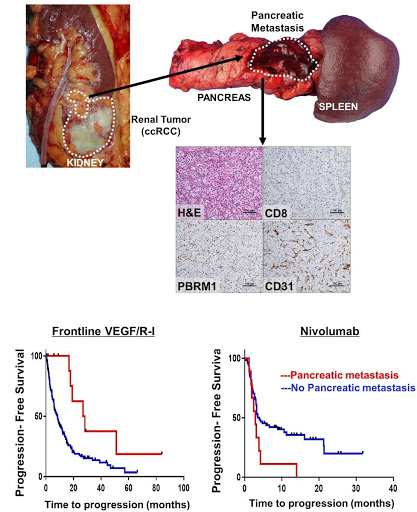 Fig. 6 | ccRCC metastatic to the pancreas is characterized by PBRM1 loss, compact small nests, a prominent vascular network, and response to VEGF inhibitors. Representative H&E and corresponding CD31, CD8 and PBRM1 IHC images from a pancreatic metastasis illustrating the typical compact small nest morphologic phenotype, increased vasculature (CD31), lack of CD8 T lymphocytes and PBRM1 loss. Kaplan Meier survival analyses for PFS in patients treated with first-line VEGF/R-I (HR 0.34 [95% CI 0.15-0.77]; p=0.007) vs. nivolumab (HR 2.15 [95% CI 1.04-4.46]; p=0.034) stratified by presence (red line) or absence (blue line) of pancreatic metastasis) (modified from Singla et al., JCI Insight 2020).
To dissect the interplay between patterns, we undertook a mathematical approach. We reasoned that if two architectures co-occurred in tumors more frequently than expected based on their individual frequencies, the process was non-stochastic. We quantitated co-occurrence based on conditional probabilities and developed a co-occurrence matrix. We applied this approach not just to architectures, but also to cytological and stromal features. This analysis revealed significant preferential associations. For example, tumors with solid sheet patterns also contained thick trabecular/ insular, large nests and compact small nests patterns. Interestingly, intra-tumoral lymphocytic infiltrates were most frequently associated with sarcomatoid and rhabdoid features, which may contribute to the better response of sarcomatoid tumors to ICI therapies34.
The co-occurrence (or exclusion) of particular patterns likely reflects evolutionary constraints. In order to further dissect the process, we generated t-distributed stochastic neighbor embedding (t-SNE) maps35. t-SNE is a machine learning algorithm that reduces high-dimensional data to two dimensions where the distance between objects is proportional to their similarity (e.g. similar objects cluster together). We applied t-SNE to ccRCC architectures. As expected, t-SNE identified several clusters as well as transitions between the clusters. To infer evolution, we superimposed tumor size as well as nuclear grade onto the t-SNE map. We used tumors with pure architectures as anchors and added vectors from small to large and from low to high grade (Figure 3). This revealed a “V” shaped evolutionary process consistent with a model where a majority of tumors start as either compact small nests or microcystic/cystic and progress to more advanced patterns converging into a solid sheet.
We sought opportunities to ‘test’ the model. We reasoned that we may use tumor outgrowth into the vasculature, where one can infer directionality, as a model. Thrombus formation occurs later in the evolutionary trajectory of ccRCC, after a primary tumor has developed, and offers an opportunity to infer the direction of growth. We compared the architectural compositions of primary tumors and matched thrombi. Consistent with the t-SNE plot trajectories, we found that in every case, the architectural patterns observed in the thrombi, which were often more aggressive, were already present in the matched primary sample30. Interestingly, in some cases, the advanced architectural pattern in the thrombus was only a minority pattern in the kidney tumor. Indolent patterns such as microcystic and bleeding follicles were infrequently found in the thrombus, even when they comprised a significant proportion of the kidney tumor. Overall, we found that the more advanced architectural patterns in the kidney tumor often seeded the tumor thrombus providing additional support to our evolutionary model (Figure 4).
Another context where we thought we may test our evolutionary model was provided by our tumorgraft (or patient-derived xenograft) program. Over the course of a decade, the UT Southwestern Kidney Cancer Program/ SPORE has transplanted tumors from over 900 patients orthotopically in mice36,37. The process of engraftment in mice recapitulates to some extent the process of metastases38, as engraftment requires small tissue samples to be able to survive and grow at a site distant from the primary tumor (in fact, in a different host), and only ~15% of tumors stably engraft. We have previously shown that samples from metastatic sites engraft at higher frequency than those from primary tumors36. In addition, engraftment predicts for reduced patient survival. Thus, efficient engraftment in mice may serve as a surrogate for tumor aggressiveness. We asked therefore whether there were differences in engraftment rates of the different patterns. We correlated sample architectures with stable engraftment in mice and found that the odds of engraftment of aggressive patterns compared to indolent patterns were 3 (95% CI 1.31, 6.92; p = 0.0104)30. Thus, engraftment efficiency, a measure of tumor aggressiveness, was higher in our more advanced patterns (Figure 4). Overall, these data in tumor thrombi and tumorgrafts are consistent with a model where more aggressive morphologically appearing subclones have greater fitness and arise from lower fitness patterns.
Vascularity is predictive of response to anti-angiogenic therapy
Beyond analyses of tumor evolution, we explored whether there may be an association between morphological patterns and drug sensitivity. We observed extensive variability in vascularity across phenotypes and hypothesized that tumors devoid of a vascular network may be less likely to respond to anti-angiogenic therapies, which largely target VEGFR-2 on endothelial cells. Interestingly, vascularity was maximal in indolent architectures and most spaced out in aggressive architectures (Figure 5). Notably, the opposite was true of inflammation, which was over-represented in more aggressive architectures. These results are in line with previous empirical analyses of the tumor microenvironment, which revealed largely non-overlapping angiogenic and inflammatory signatures39. Importantly, these data suggest a coordinated evolutionary process of the tumor and its microenvironment.
Retrospective analyses of IMmotion150 and COMPARZ trials suggested that tumors responsive to VEGF/R-I exhibit an angiogenic gene expression signature40-45 and we asked whether there was an association between a vascular stroma and response to VEGF/R-I in our cohort. We focused on patients with metastatic ccRCC that received VEGF/R-I in the frontline, and found that tumors composed predominantly of patterns characterized by reduced vascularity had shorter time to progression30.
In contrast, compact small nests architectures are characterized by an extensive vascular network and might be expected to respond to VEGF/R-I. These tumors, however, are less aggressive and less frequently metastasize. Interestingly, however, we found a correlation between tumors with compact small nests and tumors with pancreatic metastases. In addition, when multiple architectures coexisted in the primary, there was an enrichment for compact small nests among pancreatic metastases8. We asked if there was an association of ccRCC metastatic to the pancreas and response to VEGF/R-I. We observed that patients with pancreatic metastasis benefited from VEGF/R-I to a greater extent than those without (progression free survival (PFS) HR 0.34 [95% CI 0.15-0.77]; p=0.007). Conversely, these patients were refractory to ICI therapy (HR 2.15 [95% CI 1.04-4.46]; p=0.034) (Figure 6).
Finally, given that the compact small nest architecture closely resembles the architecture of Vhl/Pbrm1 deficient ccRCC in genetically engineered mouse models, we asked whether there was an association between the phenotype and underlying mutations. The rate of PBRM1 loss among pancreatic tumors was 84%, significantly higher than what might be expected among metastatic ccRCC8. Overall, these data suggest that loss of VHL and PBRM1 results in a compact small nest architecture that induces an extensive vascular network from the host, which is possibly related to the activation of hypoxia-inducible factors following VHL inactivation, and amplified by the loss of PBRM146.
In summary, these studies provide a systematic and comprehensive ontology that captures the breath of ccRCC morphologies and their clinical significance. They utilize morphology to deconvolute tumor complexity and improve our current understanding of ccRCC pleiotropy. By analyzing patterns of spatial co-occurrence, our studies identify distinct trajectories of morphological evolution. Advanced architectures, which form terminal nodes, appear more likely to expand from the primal and more indolent architectures, and demonstrate differential response to therapy. The ability to predict cancer evolution may have profound implications for clinical care and is central to oncology. Our histopathological phenotypes and molecular studies indicate that, at least in part, tumor evolution evolves along particular paths. Despite its stochastic nature, lineage and micro-environmental constraints may allow for a limited set of predictable subsequent evolutionary trajectories. Characterizing repeated evolution in cancer would have significant implications both for understanding the biology of tumor progression, and for the ability to stratify patients in the clinic.
REFERENCES
- Weikert S, Ljungberg B. Contemporary epidemiology of renal cell carcinoma: perspectives of primary prevention. World J Urol. 2010;28(3):247-252.
- Choueiri TK, Motzer RJ. Systemic Therapy for Metastatic Renal-Cell Carcinoma. N Engl J Med. 2017;376(4):354-366.
- Noone AM HN, Krapcho M, Miller D, Brest A, Yu M, Ruhl J, Tatalovich Z, Mariotto A, Lewis DR, Chen HS, Feuer EJ, Cronin KA (eds). SEER Cancer Statistics Review, 1975-2015, National Cancer Institute. Bethesda, MD. https://seer.cancer.gov/csr/1975_2015/, based on November 2017 SEER data submission, posted to the SEER web site, April 2018.
- Motzer RJ, Tannir NM, McDermott DF, et al. Nivolumab plus Ipilimumab versus Sunitinib in Advanced Renal-Cell Carcinoma. N Engl J Med. 2018;378(14):1277-1290.
- Motzer RJ, Rini BI, McDermott DF, et al. Nivolumab plus ipilimumab versus sunitinib in first-line treatment for advanced renal cell carcinoma: extended follow-up of efficacy and safety results from a randomised, controlled, phase 3 trial. Lancet Oncol. 2019;20(10):1370-1385.
- McKay RR, Kroeger N, Xie W, et al. Impact of bone and liver metastases on patients with renal cell carcinoma treated with targeted therapy. Eur Urol. 2014;65(3):577-584.
- Grassi P, Doucet L, Giglione P, et al. Clinical Impact of Pancreatic Metastases from Renal Cell Carcinoma: A Multicenter Retrospective Analysis. PLoS One. 2016;11(4):e0151662.
- Singla N, Xie Z, Zhang Z, et al. Pancreatic tropism of metastatic renal cell carcinoma. JCI Insight. 2020;5(7).
- Sellner F. Isolated Pancreatic Metastases of Renal Cell Carcinoma-A Paradigm of a Seed and Soil Mechanism: A Literature Analysis of 1,034 Observations. Front Oncol. 2020;10:709.
- Bex A, Albiges L, Ljungberg B, et al. Updated European Association of Urology Guidelines Regarding Adjuvant Therapy for Renal Cell Carcinoma. Eur Urol. 2017;71(5):719-722.
- Rini BI, Dorff TB, Elson P, et al. Active surveillance in metastatic renal-cell carcinoma: a prospective, phase 2 trial. Lancet Oncol. 2016;17(9):1317-1324.
- Motzer RJ, Penkov K, Haanen J, et al. Avelumab plus Axitinib versus Sunitinib for Advanced Renal-Cell Carcinoma. N Engl J Med. 2019;380(12):1103-1115.
- Rini BI, Plimack ER, Stus V, et al. Pembrolizumab plus Axitinib versus Sunitinib for Advanced Renal-Cell Carcinoma. N Engl J Med. 2019;380(12):1116-1127.
- Gerlinger M, Horswell S, Larkin J, et al. Genomic architecture and evolution of clear cell renal cell carcinomas defined by multiregion sequencing. Nat Genet. 2014;46(3):225-233.
- Pena-Llopis S, Vega-Rubin-de-Celis S, Liao A, et al. BAP1 loss defines a new class of renal cell carcinoma. Nat Genet. 2012;44(7):751-759.
- Turajlic S, Xu H, Litchfield K, et al. Tracking Cancer Evolution Reveals Constrained Routes to Metastases: TRACERx Renal. Cell. 2018;173(3):581-594 e512.
- Brugarolas J. Molecular genetics of clear-cell renal cell carcinoma. J Clin Oncol. 2014;32(18):1968-1976.
- Cancer Genome Atlas Research N. Comprehensive molecular characterization of clear cell renal cell carcinoma. Nature. 2013;499(7456):43-49.
- Nickerson ML, Jaeger E, Shi Y, et al. Improved identification of von Hippel-Lindau gene alterations in clear cell renal tumors. Clin Cancer Res. 2008;14(15):4726-4734.
- Gerlinger M, Rowan AJ, Horswell S, et al. Intratumor heterogeneity and branched evolution revealed by multiregion sequencing. N Engl J Med. 2012;366(10):883-892.
- Pena-Llopis S, Christie A, Xie XJ, Brugarolas J. Cooperation and antagonism among cancer genes: the renal cancer paradigm. Cancer Res. 2013;73(14):4173- 4179.
- Ho TH, Kapur P, Joseph RW, et al. Loss of histone H3 lysine 36 trimethylation is associated with an increased risk of renal cell carcinoma-specific death. Mod Pathol. 2016;29(1):34-42.
- Kapur P, Pena-Llopis S, Christie A, et al. Effects on survival of BAP1 and PBRM1 mutations in sporadic clear-cell renal-cell carcinoma: a retrospective analysis with independent validation. Lancet Oncol. 2013;14(2):159-167.
- Joseph RW, Kapur P, Serie DJ, et al. Clear Cell Renal Cell Carcinoma Subtypes Identified by BAP1 and PBRM1 Expression. J Urol. 2016;195(1):180-187.
- Kapur P, Christie A, Raman JD, et al. BAP1 immunohistochemistry predicts outcomes in a multi-institutional cohort with clear cell renal cell carcinoma. J Urol. 2014;191(3):603-610.
- Litchfield K, Stanislaw S, Spain L, et al. Representative Sequencing: Unbiased Sampling of Solid Tumor Tissue. Cell Rep. 2020;31(5):107550.
- Grignon DJ, Che M. Clear cell renal cell carcinoma. Clin Lab Med. 2005;25(2):305-316.
- Reuter VE, Tickoo SK. Differential diagnosis of renal tumours with clear cell histology. Pathology. 2010;42(4):374-383.
- Verine J, Colin D, Nheb M, et al. Architectural Patterns are a Relevant Morphologic Grading System for Clear Cell Renal Cell Carcinoma Prognosis Assessment: Comparisons With WHO/ISUP Grade and Integrated Staging Systems. Am J Surg Pathol. 2018;42(4):423-441.
- Cai Q, Christie A, Rajaram S, et al. Ontological analyses reveal clinically-significant clear cell renal cell carcinoma subtypes with convergent evolutionary trajectories into an aggressive type. EBioMedicine. 2020;51:102526.
- Gu YF, Cohn S, Christie A, et al. Modeling Renal Cell Carcinoma in Mice: Bap1 and Pbrm1 Inactivation Drive Tumor Grade. Cancer Discov. 2017;7(8):900-917.
- Nargund AM, Pham CG, Dong Y, et al. The SWI/SNF Protein PBRM1 Restrains VHL-Loss- Driven Clear Cell Renal Cell Carcinoma. Cell Rep. 2017;18(12):2893-2906.
- Espana-Agusti J, Warren A, Chew SK, Adams DJ, Matakidou A. Loss of PBRM1 rescues VHL dependent replication stress to promote renal carcinogenesis. Nat Commun. 2017;8(1):2026.
- Rini BI, Motzer RJ, Powles T, et al. Atezolizumab plus Bevacizumab Versus Sunitinib for Patients with Untreated Metastatic Renal Cell Carcinoma and Sarcomatoid Features: A Prespecified Subgroup Analysis of the IMmotion151 Clinical Trial. Eur Urol. 2020.
- Hinton LvdMaG. Visualizing Data using t-SNE. Journal of Machine Learning Research. 2008;9:2579- 2605.
- Sivanand S, Pena-Llopis S, Zhao H, et al. A validated tumorgraft model reveals activity of dovitinib against renal cell carcinoma. Sci Transl Med. 2012;4(137):137ra175.
- Elias R, Tcheuyap VT, Singla N, et al. An extensive renal cell carcinoma tumorgraft platform supporting innovation and advances in biological understanding, biomarker development and precision medicine Submitted. 2020.
- Quintana E, Piskounova E, Shackleton M, et al. Human melanoma metastasis in NSG mice correlates with clinical outcome in patients. Sci Transl Med. 2012;4(159):159ra149.
- Wang T, Lu R, Kapur P, et al. An Empirical Approach Leveraging Tumorgrafts to Dissect the Tumor Microenvironment in Renal Cell Carcinoma Identifies Missing Link to Prognostic Inflammatory Factors. Cancer Discov. 2018;8(9):1142-1155.
- Carlo MI, Manley B, Patil S, et al. Genomic Alterations and Outcomes with VEGF-Targeted Therapy in Patients with Clear Cell Renal Cell Carcinoma. Kidney Cancer. 2017;1(1):49-56.
- HakimiAA, VossMH, KuoF, etal. Transcriptomic Profiling of the Tumor Microenvironment Reveals Distinct Subgroups of Clear cell Renal Cell Cancer - Data from a Randomized Phase III Trial. Cancer Discov. 2019.
- Hsieh JJ, Chen D, Wang PI, et al. Genomic Biomarkers of a Randomized Trial Comparing First-line Everolimus and Sunitinib in Patients with Metastatic Renal Cell Carcinoma. Eur Urol. 2017;71(3):405-414.
- McDermott DF, Huseni MA, Atkins MB, et al. Clinical activity and molecular correlates of response to atezolizumab alone or in combination with bevacizumab versus sunitinib in renal cell carcinoma. Nat Med. 2018;24(6):749-757.
- Dornbusch J, Zacharis A, Meinhardt M, et al. Analyses of potential predictive markers and survival data for a response to sunitinib in patients with metastatic renal cell carcinoma. PLoS One. 2013;8(9):e76386.
- Jayson GC, Kerbel R, Ellis LM, Harris AL. Antiangiogenic therapy in oncology: current status and future directions. Lancet. 2016;388(10043):518-529.
- Li L, Kaelin WG, Jr. New insights into the biology of renal cell carcinoma. Hematol Oncol Clin North Am. 2011;25(4):667-686.
KEYWORDS: Kidney cancer • ccRCC • genomics • intratumoral heterogeneity • ontology • tumor evolution • morphology
Grant Support: This work was supported by NCI P50CA196516 (J. Brugarolas and P. Kapur).
Correspondence: Payal Kapur, MD, Professor, Kidney Cancer Program, Department of Surgical Pathology, University of Texas Southwestern Medical Center, 5323 Harry Hines Blvd. Email: payal.kapur@utsouthwestern.edu James Brugarolas, MD, PhD, Professor, Kidney Cancer Program, Department of Internal Medicine, Hematology- Oncology Division, University of Texas Southwestern Medical Center, 5323 Harry Hines Blvd. Email: james.brugarolas@utsouthwestern.edu
Conflicts of interest disclosures: None.