Submitted - Mar 22, 2022 | Revised Jun 7, 2022 | Accepted - Jun 14, 2022 | | ePublished - March 25, 2022
https://doi.org/10.52733/KCJ20n2-a1
Comparison of Papillary Renal Cell Carcinoma Type 1 and Type 2: A Secondary Data Analysis
Melissa Paquin, PhD,1 Tracy Fasolino, PhD, FNP,2 Joe Bible, PhD,3 Mary Beth Steck, PhD,2 Joel Williams, PhD.4
1. Clemson University, Hampton, GA 30228 USA.
2. School of Nursing, Clemson University, Clemson, SC 29634.
3. Mathematical and Statistical Sciences, Clemson University, Clemson, SC 29634.
4. Department of Public Health Sciences, Clemson University, Clemson, SC 29634
ABSTRACT
OBJECTIVE: The overall aim of this study was to determine if there are significant differences between type 1 and type 2 papillary renal cell carcinoma (PRCC) that can be utilized by healthcare providers. MATERIALS AND METHODS: This study performed a secondary data analysis using The Cancer Genome Atlas Kidney Renal Papillary Cell Carcinoma data to determine if there are clinically significant differences in survival, demographics (age, ethnicity, gender, and race), increased risk factors (body mass index [BMI] smoking history, neoplasm history, and malignancy history) and preferential genetic pathways between type 1 and type 2 PRCC tumors. RESULTS: Descriptive statistics were performed on a total of 156 cases to determine demographics, increased risk factors and genetic pathways. The hazard ratio, with type 1 as the reference group, was 2.459 (with 95% CI 0.9723, 6.217). Of the risk factor variables investigated, we found that smoking appeared to be associated with an increased risk of type 2 (OR 3.241 95% CI 1.066, 9.853). In the pathways analysis, we observed one significant difference between MAPK and PI3K, with the latter being significantly associated with type 2 (OR 4.968 95% CI 1.759, 14.031 Table 6). CONCLUSION: This study provides the framework for future more comprehensive research on the demographic, increased risk factor and genetic pathway differences between PRCC type 1 and type 2 tumors. Future investigations should include a more complete dataset with additional potential risk factors.
INTRODUCTION
Renal cell carcinoma (RCC) is
the 14th most common cancer
worldwide and was the cause
of 175,098 deaths in 20181. RCC
consists of numerous subtypes
including clear cell renal carcinoma,
papillary renal cell carcinoma and
most recently clear cell papillary
renal cell carcinoma. Currently, papillary
renal cell carcinoma (PRCC)
is the second most common type of
RCC, after clear cell renal cell carcinoma,
comprising approximately
15-20% of all RCC cases2,3.
PRCC is considered a
heterogeneous disease consisting
of two subtypes; type 1 and type
2. These subtypes are primarily
distinguished by their histology
and vary in prognosis, treatment
and patient outcomes. Type 1 is
histologically characterized by a
single layer of cells with sparse
basophilic cytoplasm and small
oval shaped nuclei that are present
in either the renal tubules or renal
papillae. This type can be associated
with both hereditary and sporadic
PRCC.4,5 Conversely, type 2 tumors
are histologically characterized by
large pseudostratified cells with
eosinophilic cytoplasm with large
spherically shaped nuclei that are
present in the renal papillae. These
tumors can be associated with
hereditary PRCC but are more often
associated with the sporadic form
of PRCC.6
Furthermore, research 6
has shown that patients with PRCC
type 2 tumors are correlated with a
higher rate of metastasis and have a
lower overall survival rate compared
with patients with type 1 tumors.7
The overall aim of this
study was to determine if there are
significant differences between type
1 and type 2 PRCC
that can be utilized
by healthcare
p r o v i d e r s .
Specifically, this
study sought to
determine if there
are clinically
s i g n i f i c a n t
d i f f e r e n c e s
in survival,
demographics (age,
ethnicity, gender,
and race), increased
risk factors (body
mass index [BMI]
smoking history,
neoplasm history,
and malignancy
history) and
preferential genetic
pathways between
type 1 and type 2
PRCC tumors.
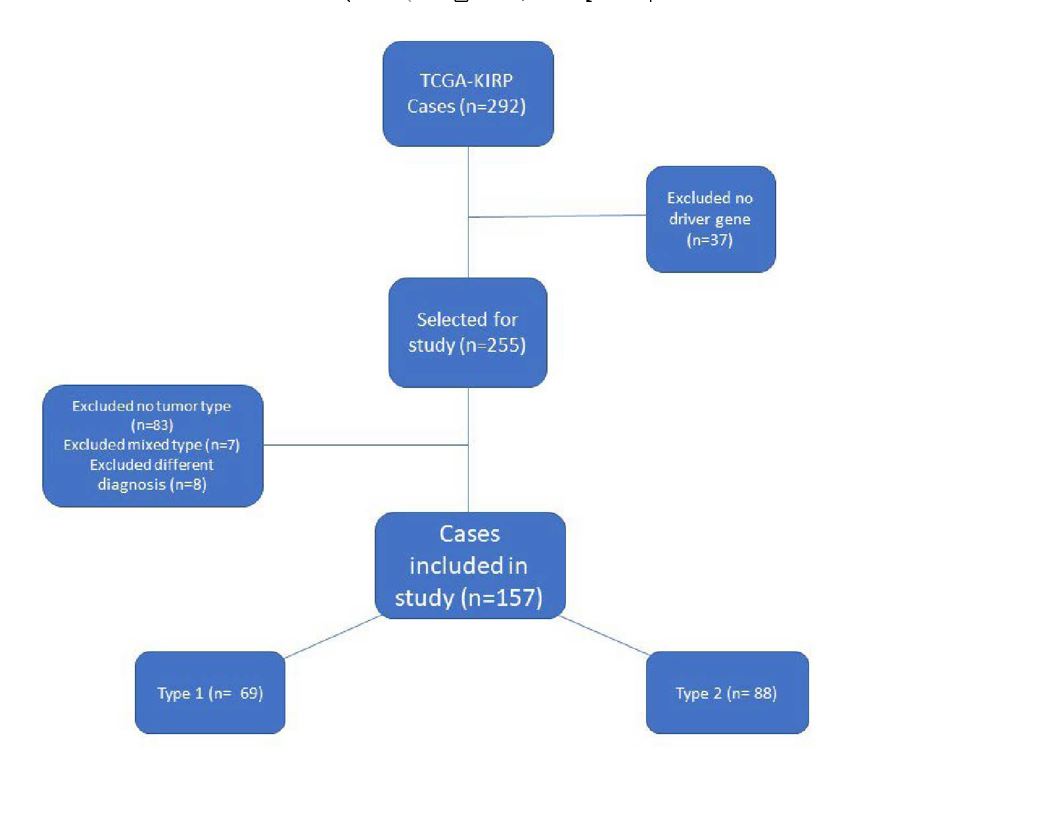
Table 1 | Descriptive Statistics for Demographic Factors
T h e epidemiology and risk factors for PRCC are largely based on the broader RCC. However, there are certain conditions that may increase an individual’s risk of developing PRCC. For instance, individuals with Hereditary Leiomyomatosis and Renal Cell Cancer (HLRCC) have a greater chance of developing PRCC type 2. There is some evidence that suggests individuals with renal insufficiencies have a greater risk of developing PRCC.8,9 Ethnicity is also linked to increased risk of developing RCC with African Americans having the highest incidence of RCCs. Sankin et al. (2011) found that African Americans had a four times greater incidence of PRCC as compared to non-African Americans.10,11 Research has demonstrated that malignant tumors utilize a wide variety of genetic alterations to modify the normal cell cycle in order to be able to divide and grow without restrictions. These modifications are accomplished by altering cell signaling pathways to promote cell growth, angiogenesis and obstruct apoptosis.12 Considering the heterogeneous nature of PRCC, there are numerous genetic alterations that occur within both type 1 and type 2 PRCC. Approximately 20% of hereditary type 1 tumors have been associated with variations in the protooncogene mesenchymal epithelial transition (MET). However, sporadic type 1 tumors have numerous genes associations as well as chromosomal abnormalities. Type 2 tumors have also been correlated with a large number of genetic and chromosomal alterations.4,13 Similarly, research has shown that renal cancers in general utilize several signaling pathways. The alteration of MET has been shown to activate the MAPK and PI3K pathways as well as other proteins involved with tumor growth.14 Gaps in research still exist for determining if there are pathway preferences between type 1 and type 2 PRCC tumors.
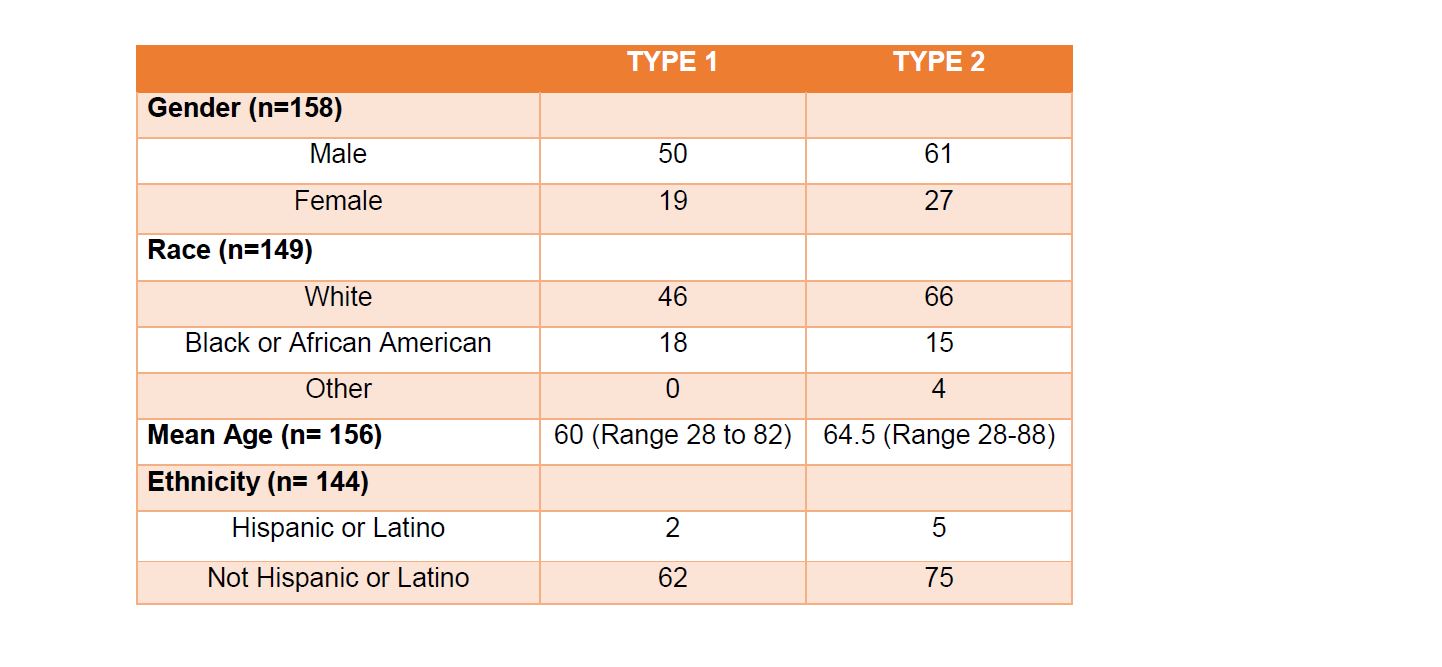
Table 1 | Descriptive Statistics for Demographic Factors
Most research on PRCC has either been umbrellaed under RCC or focused on developing a basic understanding of the disease with minimal attention to the differences between type 1 and type 2 PRCC tumors. Recently, Wong et al. (2019) investigated survival rates associated with type 1 and type 2 PRCC. The researchers found that type 2 PRCC was associated with a higher all-cause mortality rate as well as with worse reoccurrence rates as compared to type 1.7 As part of our research, we analyzed the allcause mortality for discrepancies in survival rates between type 1 and 2 PRCC. Next, we selected a demographic (baseline) model to identify a set of demographic variables that are likely to be associated with the different types of PRCC. Lastly, we investigated environmental and gene pathway associations with prevalence of the two types of PRCC.
METHODS
Sample
This study was a secondary data
analysis using data from The
Cancer Genome Atlas Kidney Renal
Papillary Cell Carcinoma (TCGAKIRP).
A review of the literature
was conducted to determine the
appropriate inclusion criteria
which included: 1) PRCC tumors,
2) distinguishes between type 1
and type 2, 3) demographics data,
gender, race, age and ethnicity, 4)
clinical data, prognosis, treatment,
preexisting conditions, 5) increased
risk factors, smoking history,
BMI, prior neoplasms and prior
malignancies, and 6) genetic analysis
of the tumors. A further review of the
literature revealed that TCGA-KIRP
is the most current and appropriate
dataset to use for this secondary
data analysis. The cBioPortal for
cancer genomics (cBioPortal) was
used in conjunction to analyze the
TCGA-KIRP data.
TCGA-Kidney Renal
Papillary Cell Carcinoma (KIRP)
data was collected from 41
institutions from 1996 to 2013. The
database adheres to a strict inclusion
policy; TCGA tumors are untreated
samples that were snap frozen. Each
tumor sample has to have a matched
normal sample from the same
patient which generally comes in
the form of the patient’s blood. The
tumors and subsequent molecular
data are cross referenced
by Biospecimen Core
Resource (BCR) to ensure
validity. Furthermore, the
BCR analyzes each sample
for pathological quality
control. This maintains
that TCGA has a highquality
tumor samples as
well as consistent molecular
data.15 Additionally, each
sample was reviewed by
a panel of six experienced
pathologist to in order
to be classified into type
1, type 2 or unclassified
PRCC. Moreover, any
samples that were preclassified
were reassessed
by the same panel to ensure
proper classification.15
The cBioPortal is a resource
that incorporates data from TCGA
as well as actively curates data sets
from the literature into a researchfriendly
source. The cBioPortal
separates PRCC genetic variations
into categories such as copy
number variations and mutations.
Furthermore, the cBioPortal
predetermines and denotes driver
genes through specific algorithms.16
The cBioPortal allows the user to
analyze specific genes, as opposed
to TCGA, which only allows users
to view the dataset as a whole and
does not denote potential driver
genes.16 Even though the cBioPortal
contains the same data as TCGA,
the cBioPortal was used to aid in the
analysis of TCGA data.
Data extraction
Both databases showed the same cases which totaled 292. The first step in evaluating the dataset was determining the demographic and clinical data. TCGA contained a manifest of demographic, clinical, and environmental data. This manifest was downloaded and converted into an Excel file. Once retrieved, the dataset was reviewed and irrelevant data was removed; such data included serum levels, blood cell counts, IDH level, tumor laterality, lymph node data, tumor dimensions, treatment data, tissue collection data, sample weights, calcium levels, and vial numbers. Data categories that were redundant were also eliminated.
Next, the cBioPortal resource was used to determine pertinent genetic information related to PRCC. The first step was to download the copy number alteration (CNA) data from this resource. A total of 10,837 genes exhibited a copy number variation. Genes that were not considered to be driver genes according to the GISTIC algorithm were eliminated from the dataset. This elimination left a total of 426 driver genes with CNA. The driver genes were then put into the BCG query to determine how many cases included one or more of the driver CNA genes. A total of 193 of the cases (66%) contained one of the driver CNA genes. In order to increase the sample population, mutated driver genes (as determined by Mutsig) were added to the query bringing the total of genes to 517 and 255 (87%) cases. Thirty-six cases did not have an association with one of the 517 driver genes and were eliminated. The driver genes were divided into categories based on their cytoband for future reference.
The remaining 255 cases were reviewed to determine whether or not they were designated type 1 or type 2 PRCC. Out of the 255 cases, 115 cases had no designation in the type category. The pathology report of each of the 115 cases was reviewed to see if a pathologist had designated the tumor as either type 1 or type 2. Seven more cases were determined to be a mix of type 1 and type 2 histology and were also removed. Additionally, eight more cases were either mislabeled as PRCC or determined to favor a different cancer type per the reviewing pathologist. These eight cases did not include a TCGA addendum that disputed the cancer typing and therefore were removed from this dataset. (See Figure 1). At the conclusion of this analysis, 88 cases were designated as type 2, 69 cases were type 1, and 83 cases were undesignated. The 83 undesignated cases were subsequently removed from the dataset in order to preserve the validity and continuity of the data.
ANALYSIS
Descriptive Statistics and Survival Analysis
Descriptive statistics were utilized to determine demographics, increased risk factors and genetic pathways. The survival analysis was conducted for the TCGA-KIRP analytic file using R version 3.6.2. , the survival(v3.2-13) and the survminer (v0.4.9) packages.21-23 A cox-proportional hazard model was fitted on the overall survival times of 156 patients (1 had a survival time of 0 indicating that they were diagnosed post-mortem or there was an error in entry) to determine if there were evidence that survival rates differ between type 1 and 2 PRCC.
Logistic Regression
For the next three phases of our statistical analysis, SASTM software, Version 9.4 of the SAS system for Windows was utilized. The demographic model selection included age at diagnosis, race, ethnicity and sex, as candidate descriptors relating to PRCC tumor type. The demographic model selection utilized forward selection with a relaxed p value (<0.1) to determine the appropriate variables to be included in the model. The selected demographic model included Age at Diagnosis (OR 1.045 95% CI 1.014, 1.078, Table 5) as well as 3 Category Race (White, Black or African American and Other) was used as the baseline model for the increased risk factor variables. Each increased risk factor variable; BMI, smoking status, prior neoplasms and prior malignancies, were added univariately to the demographic model controlling for age at diagnosis and race to identify associations.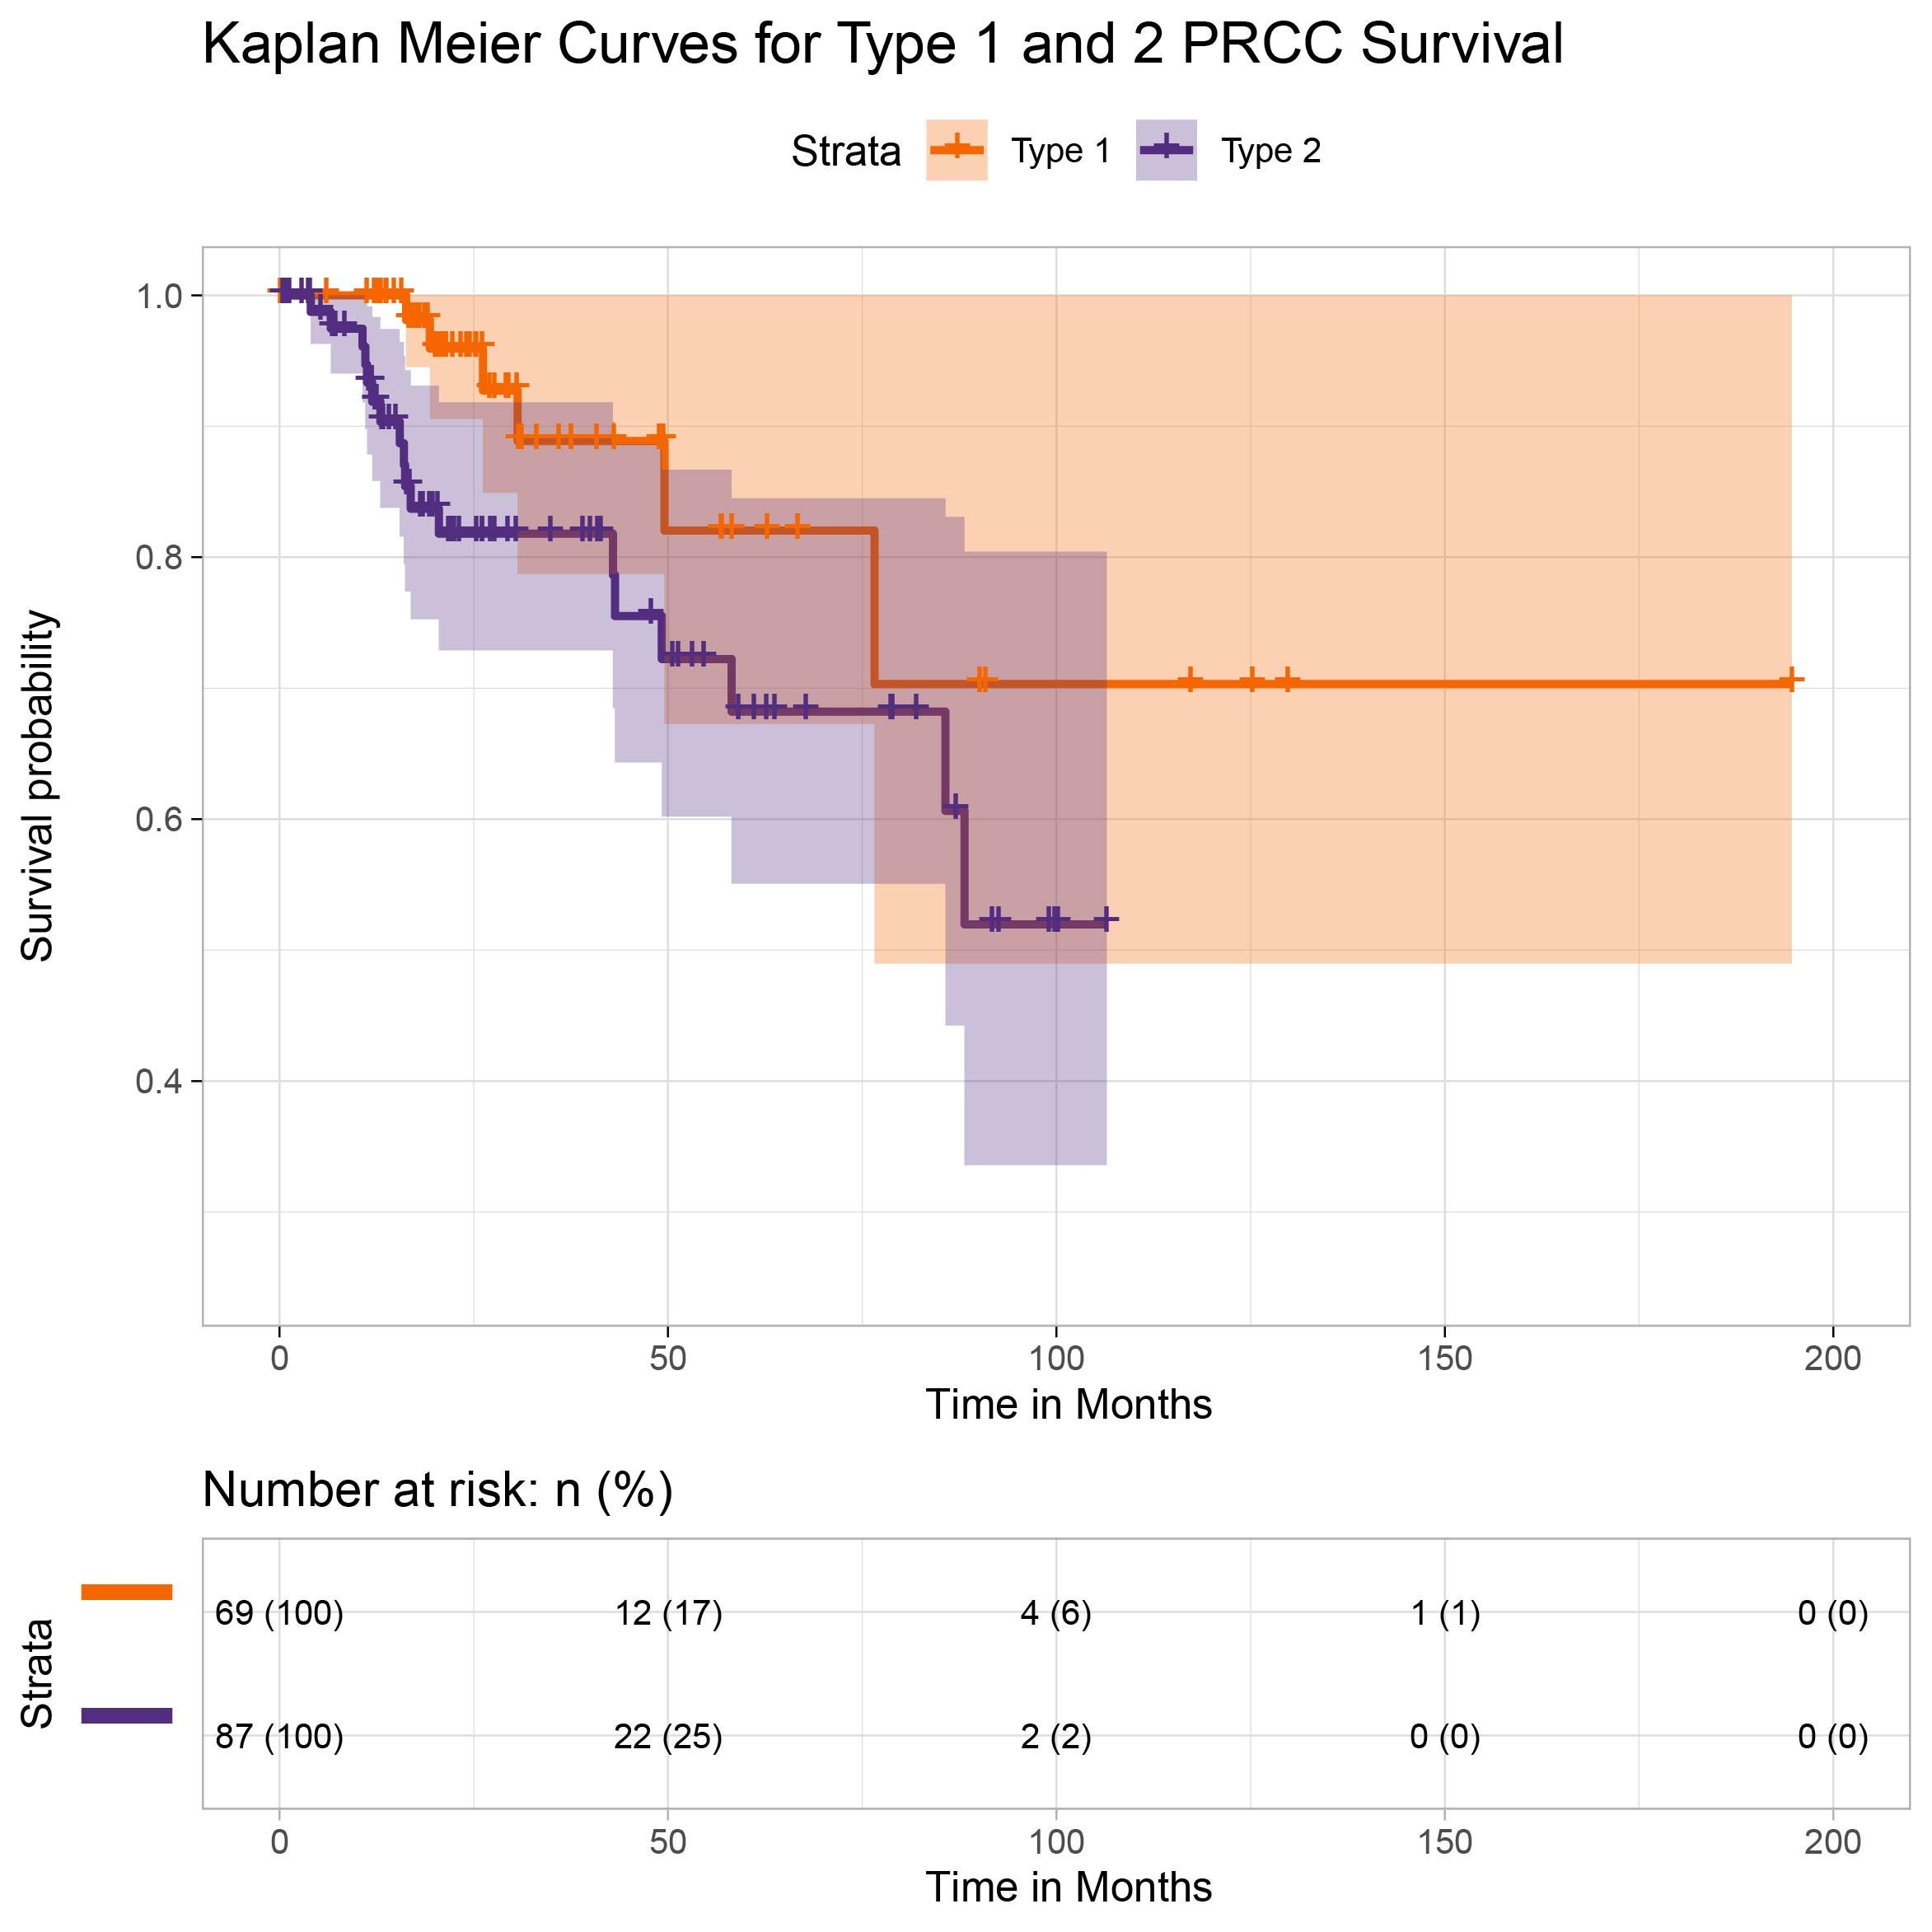
Figure 2 | Kaplan Meier curves for Type 1 and 2 PRCC survival
RESULTS
Descriptive Statistics
For the 69 patients designated as type 1 tumors, 50 were male and 19 were female with a median age of 60 (range 28 to 82). In terms of race, 46 were white, 18 were black or African American, and 5 were unspecified. Ethnicity was reported as 62 non- Hispanic or Latino, 2 were Hispanic or Latino and 5 were unspecified.For the 88 patients designated as type 2 tumors, 61 were male and 27 were female with a median age of 65 (range 28 to 88). In terms of race, 66 were white, 15 were black or African American, and 7 were unspecified. Ethnicity was reported as 75 were non-Hispanic or Latino, 5 were Hispanic or Latino and 8 were unspecified (Table 1). Due to the sparsity in the demographic factor levels, the following variable levels were collapsed; Asian and American Indian.

Table 2 | Descriptive Statistics for Increased Risk Factors
Smoking categories were defined as life-long non-smoker (1), current smoker (2), reformed smoker >15years (3), reformed smoker <15 years (4) and reformed smoker unknown length (5). Table 2 describes the smoking status of type 1 and type 2 PRCC tumors. Smoking categories 4 and 5 were collapsed together due to data sparsity in the increased risk factor variables. The existence of prior neoplasm was defined in the database as ‘yes’ or ‘no’. Two patients with type 1 PRCC had known prior neoplasm were as 9 patients with Type 2 reported prior neoplasm. Similarly, prior malignancies were also defined as ‘yes’ or ‘no’. Sixteen patients with type 1 reported prior malignancies and 14 patients with type 2 reported prior malignancies (Figure 2). The most common pathway in type 1 was the MAPK pathway and in type 2 was the PI3K pathway Table 3).
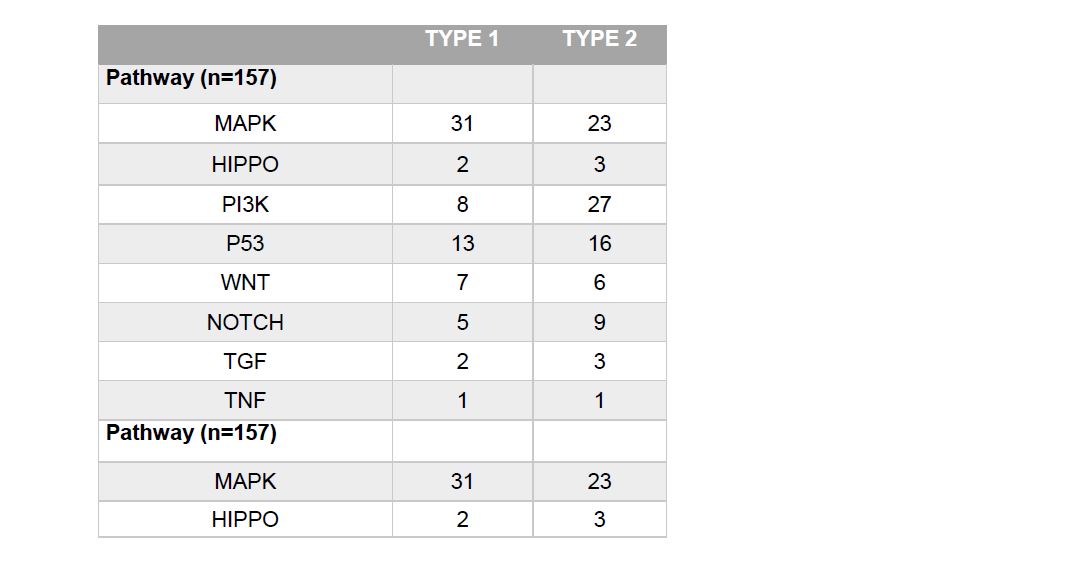
Table 4 | Demographics Model
Overall Survival
The hazard ratio, with type 1 as the reference group, was 2.459 (with 95% CI 0.9723, 6.217). This result did not provide sufficient evidence that the two types differ significantly in all-cause survival (α=.05). However, given the relatively small sample size and high rate of censoring, it is not surprising that our results do not provide as striking a contrast between the two as supported by Wong et al. (2019). (Censoring rates were 91.3% for Type 1 and 79.5% for type 2, respectively, which consequently prevents us from being able to report median survival without making parametric assumptions). Survival rates are illustrated via the Kaplan Meier curve included in Figure 2.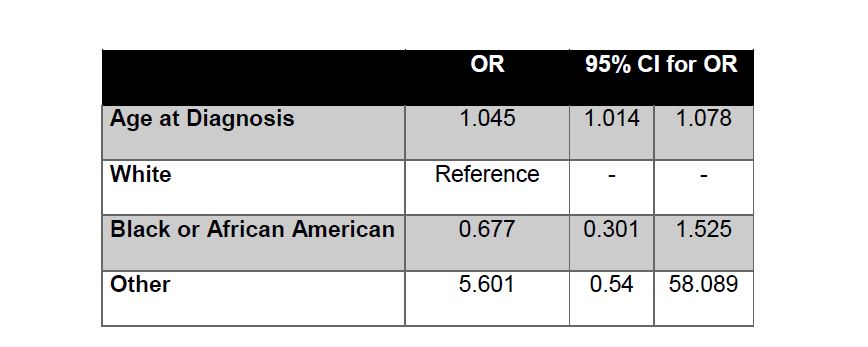
Table 4 | Increased Risk Factor Model
Logistic Regression
Odd ratios (OR) and confidence intervals (CI) are reported in Tables 5 and 6 for each variable in the increased risk factor and pathway analyses. Of the risk factor variables investigated, we found that smoking appeared to be associated with an increased risk of type 2. Specifically, being a reformed smoker of unknown length or less than 15 years, was positively associated with type 2 PRCC compared to lifelong non-smokers (OR 3.241 95% CI 1.066, 9.853 Table 5). None of the other increased risk factors had significant association with tumor type. In the pathways analysis, we observed one significant difference between MAPK and PI3K, with the latter being significantly associated with type 2 (OR 4.968 95% CI 1.759, 14.031 Table 6). All pairwise comparisons were made between pathways and the MAPK/PI3K comparison was the only one found to be significant. In all analyses, type 1 was used as the reference level for each model and the OR corresponds to odds of type 2 Vs 1.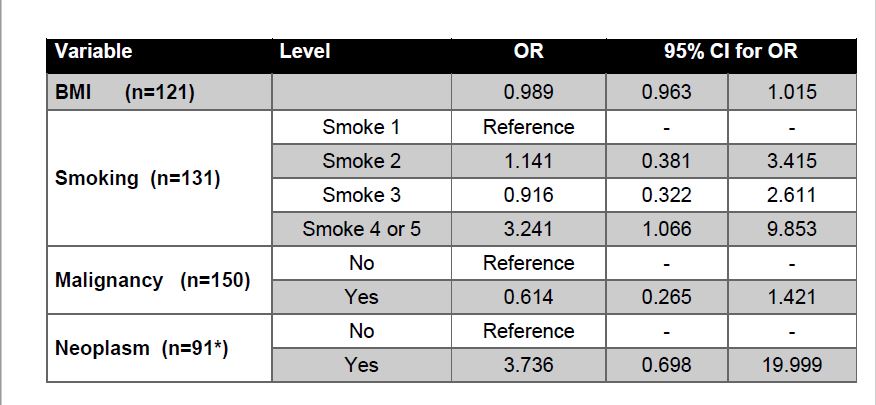
Table 2 | Descriptive Statistics for Increased Risk Factors
DISCUSSION
It is important to note that current findings from the International Society of Urological Pathology (ISUP) suggests that the PRCC type 1 subtype is the most uniform morphologically, immunohistochemically, and in terms of molecular features. ISUP also suggests that PRCC type 2 is not a distinct neoplasm but rather a combination of multiple distinct neoplasms. As such, type 2 PRCC is a distinctly different disease as compared to type 1 and contains multiple clinically and molecularly heterogeneous subtypes.24 Additionally, the use of type 1 and type 2 terminology is evolving as PRCC becomes better understood. To the best of our knowledge, our study is the first to collectively examine the demographic, increased risk and pathway associations between type 1 and type 2 PRCC tumors. Furthermore, while our findings with respect to the survival analysis were not significant, it does provide marginal evidence to confirm the findings of Wong et al. (2019) in that survival rates for type 2 are shorter than those diagnosed with type 1. 7 While our analysis was limited by small sample size, certain variables were linked to increased probability of type 2 PRCC tumors. The age at diagnosis variable was considered significant with an older adult having increased risk of type 2. Our result is consistent with Wong et al. (2019) who reported a higher age at time of nephrectomy for patients with type 2 tumors as compared with type 1 tumors.7Smoking was the only increased risk factor that was significant in determining the probability of having the type 2 tumor type versus type 1. Individuals who were reformed smokers of less than 15 years (as well as reformed smokers of unknown length) had a greater risk of developing a type 2 tumors as compared to lifelong non-smokers. Furthermore, type 2 PRCC tumors tend to be sporadic as compared to type 1, meaning that increased risk factors may have a greater impact on the development of type 2 tumors.6 However, further research needs to be conducted on the effects of smoking on the growth of specific tumor subtypes.
Although smoking was the only significant increased risk factor variable, further research should be conducted on a larger sample size with less missingness to better compare increased risk factors variables between tumor types. Specific focus should be put on prior neoplasms since they have been associated with a number of renal cell cancer syndromes that are considered to increase the risk of PRCC. For example, the most common renal cell cancer syndrome, von Hippel-Lindau syndrome, is characterized by benign tumor growths and has a 40% chance of developing renal cancer, including type 2 PRCC. Additionally, hereditary leiomyomatosis and renal cell cancer (HLRCC), is characterized by harmatomas with an increased risk of developing type 2 PRCC. 8,17 Considering the number of renal cell cancer syndromes that are both associated with an increased PRCC risk and are characterized by neoplasms; further research should be conducted to determine if prior neoplasms is a determining factor in PRCC subtype.
The findings in this study have potential implications for future treatment options. The higher rate of MAPK pathway in type 1 supports ongoing studies of the role of the MET gene in clinical trials. The MET gene codes for c-Met, a tyrosine kinase protein that is involved with the MAPK pathway. When c-Met binds to its ligand, HGF, a downstream cascade is started that leads to the activation of the MAPK pathway which promotes cell migration and tumor proliferation. 18 Seeing as 20% of type 1 tumors contain a MET mutation, it is not surprising that MAPK is the preferred pathway of type 1 tumors. Furthermore, the PI3K pathway was found to be significant in the probability of having a type 2 tumor as well as being the preferred pathway of type 2. The findings in this study support the ongoing efforts in determine drug treatment therapies that target the PI3K pathway. PI3K is comprised of lipid kinases that once activated, begin a downstream cascade that leads to cell growth and survival. PI3K pathway has a strong association with the inactivation of PTEN, which has been correlated poor patient outcomes.19,20
CONCLUSION
Despite the imperfect database this study found that there is a trend in the data that is clinically significant Furthermore, this study provides the framework for future more comprehensive research on the demographic, increased risk factor and genetic pathway differences between PRCC type 1 and type 2 tumors. Future investigations should include a more complete dataset with additional potential risk factors. Given the differences in survival rates, such investigations will provide clinicians a better understanding of tumor types allowing for quicker more accurate diagnosis and evidence-based treatment plans.CONFLICT OF INTEREST
All authors listed on this study have no conflicts of interest that may be relevant to the contents of this manuscript.
FUNDING
NoneACKNOWLEDGMENTS
NoneREFERENCES
Correspondence to: Melissa Paquin, PhD. 235 Galway Lane, Hampton, GA 30228 Email: mpaquin@clemson.edu