
Moving Beyond BMI – Developments in Body Composition and Muscle Measurement in Renal Cell Carcinoma
Hannah Dzimitrowicz, MD,1 Jordan Infield, MD,1 Fides Regina Schwartz, MD,2 Rajan T. Gupta, MD,2,3 and Michael R. Harrison, MD,3,41. Department of Medicine, Duke University School of Medicine, Durham, NC, USA
2. Department of Radiology, Duke University, Durham, NC, USA
3. Duke Cancer Institute Center for Prostate and Urologic Cancers, Durham, NC, USA
4. Department of Medicine, Division of Medical Oncology, Duke University, Durham, NC, USA
ABSTRACT
Body composition, namely the distribution and quantification of muscle and adipose tissue, are of increasing interest as potential prognostic indicators in patients with renal cell carcinoma (RCC). Herein, we review the available literature examining body composition in relation to outcomes for patients with RCC, methodology used to quantify muscle and adipose tissue using cross-sectional imaging, and future directions for translation of these findings into clinical care.
INTRODUCTION
The Obesity Paradox, BMI, and RCC
The Obesity Paradox, BMI, and RCC Excess body weight, primarily measured using body mass index (BMI), is associated with an increased risk of developing at least thirteen common cancers, including renal cell carcinoma (RCC), with the cumulative risk for RCC estimated to increase by 4% for each 1 kg/ m2 increment in BMI. 1-4 A variety of biologic mechanisms have been proposed as potential explanations for this relationship between adiposity and increased risk of cancers including RCC.5,6 These include: altered sex hormone metabolism, increased insulin and insulin-like growth factor (IGF) signaling, adipokine pathophysiology and its association with a state of chronic inflammation and microbiome effects.5,6 Importantly, no single mechanism is responsible for this relationship in RCC and it is likely a multifactorial and heterogenous process.
Paradoxically, patients who
develop RCC and have an elevated
BMI seem to have a more favorable
prognosis and survival advantage
compared to patients with normal
BMI. This “obesity paradox” in RCC
has been demonstrated in patients
with locoregional disease undergoing
nephrectomy7-9 as well as patients
with metastatic RCC (mRCC)
receiving systemic therapy. 10,11
The largest and most
widely cited study demonstrating
this protective role of elevated
BMI in patients with mRCC
included 1,975 patients from the
International mRCC Database
Consortium (IMDC) treated with
anti-angiogenic targeted therapies.
The authors demonstrated that high
BMI (≥25 kg/m2) was associated
with improved overall survival
(OS) and progression free survival
(PFS) even after adjustment for
IMDC prognostic criteria and
baseline characteristics.10 They
then externally validated these
findings in a pooled analysis of 4,657
patients with mRCC treated with
tyrosine kinase inhibitors (TKI) in
prospective clinical trials.10
After these initial studies
that predominantly included
patients on TKIs, in recent years,
multiple groups have described
outcomes by BMI in patients with
mRCC receiving immune checkpoint
inhibitor (ICI)-based regimens.
Conflicting results were observed
in smaller, earlier studies – some
demonstrated a protective effect of
elevated BMI and others found the
opposite.12-16 Recently, however, a
large study including 735 patients
from the IMDC database receiving
PD-1/PDL-1 inhibitors (alone or
in combination) demonstrated
that patients with BMI >/= 25 kg/
m2 had significantly improved OS
(1 year OS rate of 79% vs 66%; P =
0.03) and had numerically higher
response rates and time to treatment
failure.11 This large study supports
the conclusion that the obesity
paradox, as measured by BMI, also
extends beyond locoregional disease
to patients with mRCC treated with
modern ICI-based regimens.
Numerous hypotheses have
attempted to explain this clinical
observation, including potential
confounding factors and biological
differences between tumors in
patients with elevated BMI versus
normal BMI. Low fatty acid synthase
gene expression, which is inversely
correlated with BMI, was associated
with longer OS in anti-angiogenic
targeted therapy-treated patients
and proposed as a potential reason
for these differences in outcomes.10
Additionally, transcriptomic
analysis suggests that patients with
elevated BMI have tumors with
upregulation of genes associated
with angiogenesis and peritumoral
adipose tissue with increased gene
signatures of hypoxia, inflammation,
and immune cell infiltration.17 In
a recent issue of Kidney Cancer
Journal, Dr. Ritesh Kotecha expertly
reviewed recent mechanistic insights
into the role of obesity in RCC
biology and potential implications
for future therapies.18 Contrastingly,
an alternative explanation proposed
by some groups for the commonly
termed “obesity paradox” is that
these obesity-survival analyses
represent reverse causation with
more aggressive cancers causing
increased cachexia rather than
increased adipose tissue impacting
the growth and behavior of the
cancer.19
Notably, these studies
characterizing the role of obesity
in relation to RCC utilize BMI,
usually from a single baseline
measurement, as a surrogate marker
of adiposity. BMI, simply a person’s
weight in kilograms divided by the
square of height in meters is easily
captured and has widely accepted
classifications of underweight (BMI
<18.5 kg/m2), normal weight (BMI
18.5 to 24.9 kg/m2), overweight (BMI
25.0 to 29.9 kg/m2), and obese (BMI
≥30.0 kg/m2). BMI, however, treats
all mass as equal, not distinguishing
the proportion of adipose or muscle
mass or distribution of these tissues,
and allowing for great heterogeneity
in body composition for patients at
the same BMI. Thus, more precise
measures of body composition,
including adipose and muscle mass
and their distribution (visceral
versus subcutaneous adipose tissue,
for example) are of interest to
better understand their impact on
outcomes in patients with RCC and
other cancers.
Getting more granular on BMI:
Radiologic measurement of body
composition
The use of computed
tomography (CT) imaging
allows detailed assessment and
measurement of different body
tissues, including adipose tissue
and skeletal muscle, providing more
accurate measurement of body
composition than BMI; however,
due to associated costs and radiation
exposure, the value of CT would be
limited if its role were solely for
assessment of body composition.
Uniquely, though, patients with
cancer are routinely assessed with
serial high-resolution diagnostic CT
imaging to monitor tumor growth
and response to therapy and thus
these images could be used for
opportunistic body composition
analysis.
The cross-sectional area of
tissues in single images from the
region of the third lumbar vertebrae
(L3) appears to correlate strongly
with whole body adipose tissue,
including visceral and subcutaneous
adipose tissue, and skeletal muscle,
while not including most visceral
organs; thus, images taken from
L3 are widely used to quantify
these tissues. 20-22 Specific tissues
are identified based on anatomic
features and demarcated based
on well characterized Hounsfield
unit (HU) reference ranges using
commercially available software
for analysis.22 This methodology
allows for the quantification of
multiple tissue types, including
skeletal muscle, subcutaneous
adipose tissue, visceral adipose
tissue, and intermuscular adipose
tissue. Commonly, these values are
then converted to indices (skeletal
muscle index, subcutaneous fat
index, visceral fat index, and
intermuscular fat index, for
example) by dividing by height (m2)
to allow cross-patient comparison.
Commercially available software
makes this analysis more accessible
to researchers, however, it does still
require segmentation of different
tissue areas by a trained clinician
or researcher with anatomical and
imaging knowledge (Slice-O-matic;
Tomovision, Montreal, Canada).22
Automated and semi-automated
software are being developed to
make this methodology more
accessible. For example, ABACS
(Automatic Body composition
Analyzer using Computed
tomography image Segmentation)
is a commercially available add-on
software to Slice-O-Matic that has
the ability to automatically segment
skeletal muscle and adipose tissue
at L3 to estimate tissue areas and
their mean radiodensities and has
been externally validated with
similar measurements to manual
segmentation analysis.23
The importance of adipose tissue
assessment by radiologic
measurements
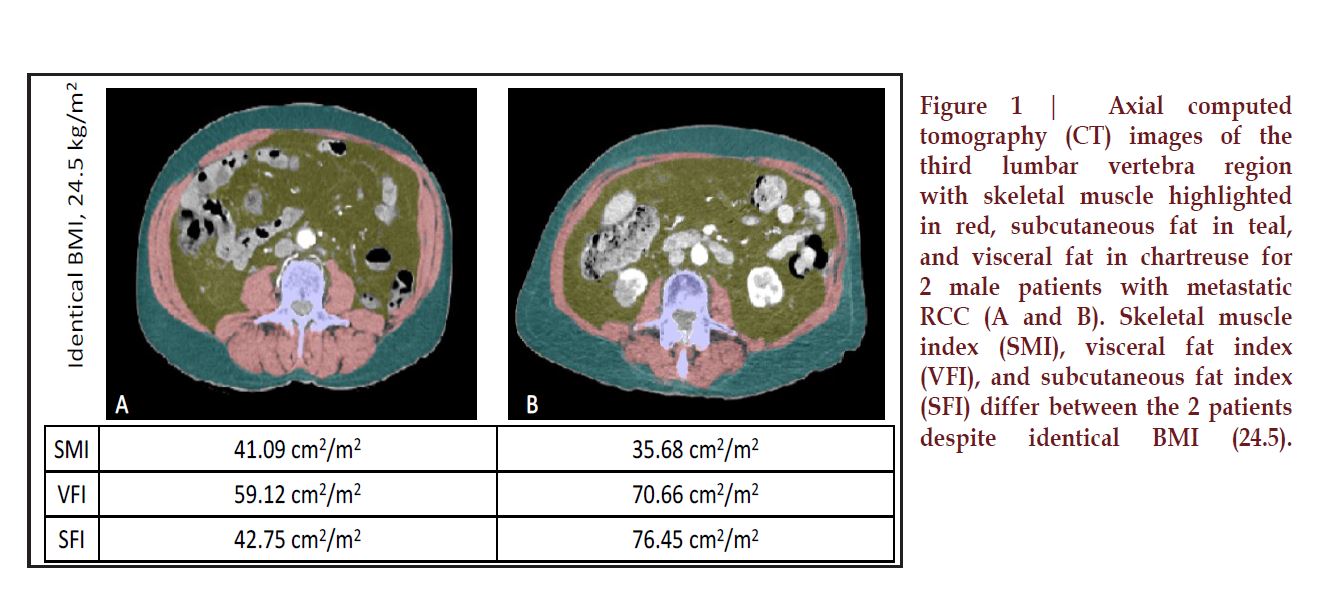
There can be substantial
variation of body composition within
each BMI group; that is, patients
may have drastically different
adipose components to their body
composition at the same BMI
(Figure 1). With CT scans readily
available for patients undergoing
oncologic treatment and using the
methodology described above,
researchers have aimed to better
understand the role that adipose
tissue plays along with BMI in RCC
outcomes, with varying results.
Primarily, researchers have
aimed to quantify different adipose
tissue components, subcutaneous
fat area (SFA) and visceral fat area
(VFA), at a baseline timepoint
and evaluate whether these values
have prognostic value in patients
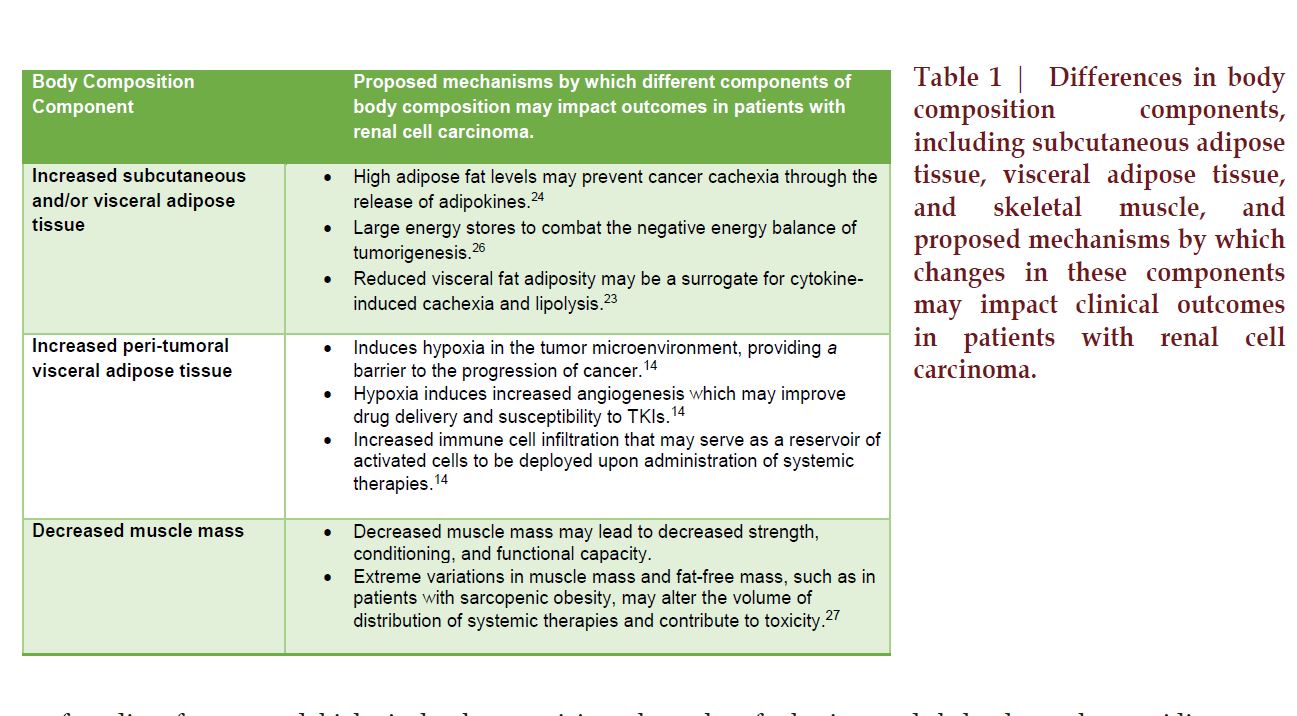
with RCC (Table 1). In addition to
obvious differences in anatomic
location, visceral and subcutaneous
adipose tissue are physiologically
and structurally different. Visceral
adipose tissue is more cellular,
vascular, innervated, and generally
contains more inflammatory cells,
immune cells, and glucocorticoid
and androgen receptors than
subcutaneous adipose tissue, among
other differences.24
In patients with localized
RCC who underwent nephrectomy,
adipose tissue measurements did
not account for the positive impact
of elevated BMI on outcome.25
Baseline SFA was highly correlated
with BMI (r = 0.804), however, after
adjustment for sex, neither SFA nor
VFA was significantly associated
with tumor grade, stage, or overall
survival, despite BMI being
associated with improved OS.25
In contrast, in the metastatic
setting, primarily studied in
patients receiving anti-angiogenic
targeted therapies, adipose tissue
measurement appears to have a
stronger association with outcomes
based on available studies. In a study
of 114 patients with mRCC receiving
systemic therapy, baseline elevated
visceral fat accumulation (defined as
≥100 cm2) correlated with improved
PFS (P = 0.0070) and OS (P = 0.0001)
and its addition to the Memorial
Sloan Kettering Cancer Center
(MSKCC) classification improved
the model’s prognostic value in this
patient cohort.26 Increased adipose
tissue may more accurately reflect
the role of body composition in
predicting outcomes of patients with
mRCC treated with anti-angiogenic
therapies. Another study measuring
baseline BMI, BSA, VFA, and SFA
in patients with mRCC treated
with a TKI (sunitinib, sorafenib, or
axitinib) or bevacizumab found that
higher than average VFA and SFA
were significant predictors of longer
PFS and OS with BMI and BSA only
demonstrating a trend towards
association.27 Contrastingly, in a
population of patients with mRCC
who received anti-angiogenic
targeted therapies (bevacizumab,
sunitinib, or sorafenib) (n = 64)
or cytokines (n = 49) as first line
treatment evaluating VFA and SFA,
after multivariate analysis, high VFA
was associated with shorter TTP
and OS in the antiangiogenic agenttreated
patients with no association
seen in the patients treated with
cytokine therapy.28 Of note, none
of these studies included patients
receiving immune checkpoint
inhibitors, so any prognostic role
adipose tissue composition may play
in this setting is unknown.
Similar to the m easurement
of adipose tissue, cross sectional
imaging can be used to calculate
skeletal muscle area and
radiodensity, which can serve as
surrogates for body muscle mass
and classification of sarcopenia.
Using optimal stratification and OS
as the outcome, sex-specific skeletal
muscle index thresholds have been
developed to define sarcopenia
as measured on CT images.29,30
Initially characterized by Prado et al.
in a population of obese Canadians
with GI and lung malignancies
and later extended to include nonobese
patients by Martin et al., SMI
thresholds for sarcopenia are widely
accepted according to sex and BMI.
The prevalence of sarcopenia in
patients with RCC, measured by SMI,
has ranged across studies, including
rates of 47% in localized RCC, 29%
in patients with mRCC undergoing
cytoreductive nephrectomy, and
36 – 68% in patients with mRCC
receiving systemic therapy.31-35
In patients with localized RCC
undergoing nephrectomy,
sarcopenia was independently
associated with cancer-specific and
all-cause mortality after radical
nephrectomy.31 In patients with
mRCC undergoing cytoreductive
nephrectomy, sarcopenia was
an independent predictor of OS
with sarcopenia associated with
worse OS.32 Notably, these studies
measured SMI at baseline as a
measure of sarcopenia rather than
measuring changes in muscle mass
or development of sarcopenia over
time.
In patients with mRCC receiving
primarily anti-angiogenic targeted
therapies, studies have evaluated
the impacts of baseline sarcopenia
and changes in skeletal muscle
over time on survival and therapyrelated
toxicities. In a study of
92 patients with mRCC receiving
systemic therapy (33% targeted
agents, 47% cytokine therapy),
baseline sarcopenia was associated
with worse OS and integration
of sarcopenia into the MSKCC
risk model improved the c-index,
suggesting that baseline sarcopenia
was an important prognosticator
in addition to previously identified
clinical factors.33 Patients treated
with sorafenib in a phase III
clinical trial lost skeletal muscle
mass progressively over the course
of therapy compared to patients
receiving placebo based on analysis
of baseline, 6-month, and 12-month
CT images.34
To characterize m uscle loss
over time and the potential impact
on outcomes, skeletal muscle was
measured on CT scans at baseline
and at 3-4 months into treatment
for 101 patients with mRCC
receiving an anti-angiogenic TKI
(sunitinib, sorafenib, or axitinib)
or mTOR inhibitor everolimus
on clinical trial.35 Muscle loss ≥
5% was a significant prognostic
factor for PFS (hazard ratio [HR]:
1.744, 95% confidence interval [CI]: 1.077–2.826, P = 0.024) and
overall survival (HR: 2.367, 95%CI:
1.253–4.469, P = 0.008), and the
addition of muscle loss to the Heng
model significantly improved its
discriminative ability. Additionally,
patients with early skeletal muscle
loss experienced more doselimiting
toxicities. Notably, baseline
sarcopenia was not associated
with patient survival, suggesting
that decline in muscle mass has
prognostic value rather than
baseline decreased muscle mass in
this setting.35 Contrastingly, low
baseline SMI was an independent
prognostic factor compared to
high SMI for patients with mRCC
receiving everolimus in another
study, and there was no difference
in toxicity attributed to everolimus
based on SMI.36 Based on available
data, decreased skeletal muscle,
both at baseline and its progressive
loss, appears to be associated
with worse outcomes in patients
with mRCC, but findings across
studies and treatment regimens are
somewhat heterogenous, suggesting
additional contributing factors and
lack of generalizability. Assessment
of muscle mass and sarcopenia in
patients with mRCC on ICI-based
regimens is limited, similar to the
dearth of knowledge regarding
studies of adipose tissue in patients
on ICIs. Limited data available
across cancer types suggests that
sarcopenia may impact outcomes
in patients on ICIs. In a study of
100 patients across cancer types (15
patients had RCC) treated with PD-1/
PD-L1 inhibitors, patients with low
SMI had significantly shorter OS,
however, there was no significant
association with clinical response,
suggesting in this small population,
that sarcopenia may be prognostic
but not predictive of response to
immunotherapy.37
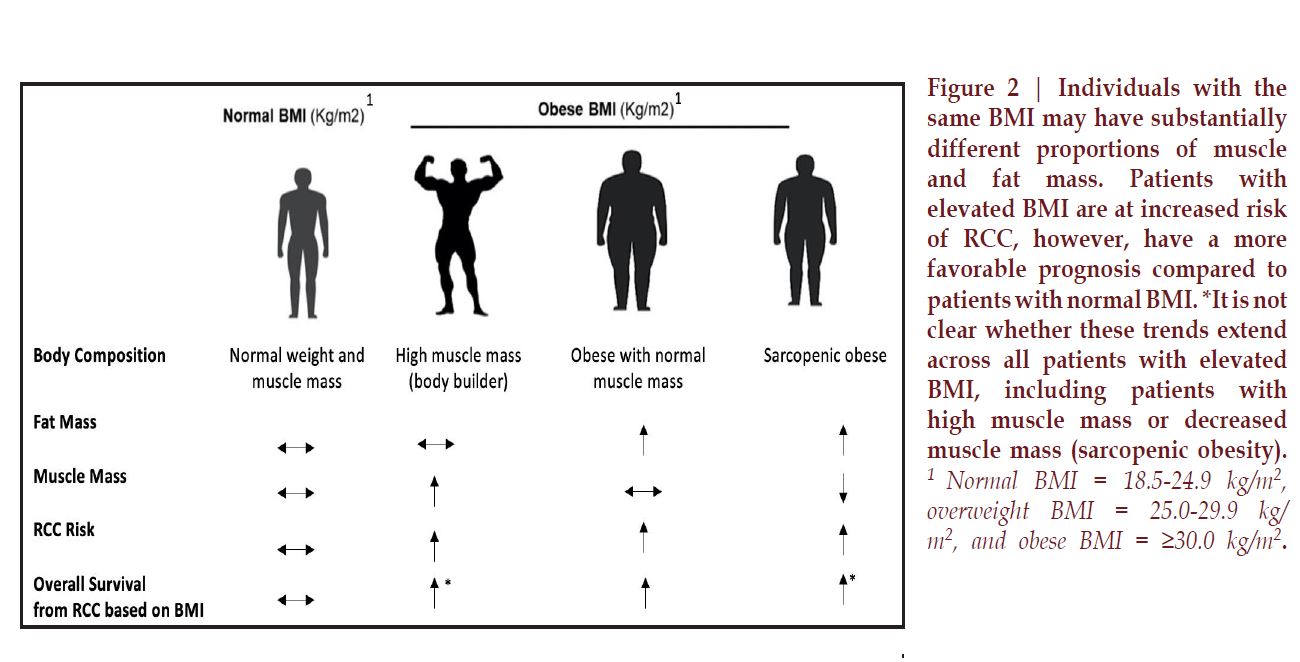
Complicating clinical
assessment of muscle mass over
time, obesity often masks the loss
of skeletal muscle, and skeletal
muscle can be lost concurrently
with an increase in adipose tissue,
a condition termed sarcopenic
obesity (Figure 2).29 It is estimated
that approximately 1 in 10 patients
with advanced cancer meets criteria
for sarcopenic obesity and 1 in
4 obese patients is sarcopenic.38
Across cancer types and treatments,
sarcopenic obesity is independently
associated with higher mortality
and higher complication rates. Thus,
the identification of sarcopenic
obesity is of interest and has not
been well characterized in patients
with mRCC.30 In patients with
mRCC enrolled in a clinical trial
receiving sorafenib or placebo, 34%
of patients with a BMI >25 kg/m2
were sarcopenic, suggesting that
a significant number of patients
with mRCC have sarcopenic obesity
which may mask muscle loss if only
BMI is measured.34 In this study, the
median time from diagnosis of RCC
to randomization was 38 +/- 4.4
months, so it is unclear if these rates
of sarcopenic obesity are applicable
to patients at the time of diagnosis
or earlier in treatment. There is
not data describing the impact of
sarcopenic obesity on patients with
RCC receiving ICIs, however, in a
single center study of 68 patients
with melanoma receiving anti-PD1
therapy, sarcopenic overweight
(BMI ≥ 25 kg/m2) was associated
with increased early acute limiting
toxicities.39
One argument against
existing methods to assess body
composition using CT images
is that available methodology is
time consuming, expensive, and
requires specialized training; easily
implementable measurement tools
would improve this. Several studies
have explored the use of the digital
ruler available in most radiologic
software as a way of measuring
skeletal muscle area at L3, assessing
height and width of the psoas and
paraspinal muscles to compute their
combined “linear area”.40 This linear
area was highly correlated with total
cross-sectional area assessed using
standard methods, and low linear
area was associated with increased
risk of death in 807 patients with
non-metastatic colon cancer
(HR 1.66; 95% CI: 1.22, 2.25).40
Additionally, increasingly available
automated and semi-automated
software to segment skeletal muscle
and adipose tissue at L3 makes these
measurements implementable in
research settings and potentially in
future clinical practice.23
As highlighted in the
American Society of Clinical
Oncology guideline on the
management of cancer cachexia,
improvements in methodology that
ease clinical implementation of
radiologic imaging of muscle mass
are needed as is the development of
novel biomarkers to easily measure
and follow skeletal muscle mass in
clinical settings.41 One such potential
biomarker is the D3-creatine
dilution method (D3Cr), which
provides a direct, non-invasive, and
accurate measure of muscle mass.
The D3Cr dilution method has been
previously described as a method
to measure muscle mass.42 Briefly,
total body creatinine pool size, and
subsequently total body muscle mass,
are assessed using a single oral dose
of deuterated creatine (D3-creatine)
which is absorbed and diluted by
entry into the endogenous pool of
creatine in skeletal muscle. Labelled
creatinine and unlabeled creatinine
are then measured in a urine sample
3-6 days later and included in an
algorithm to determine total body
creatine pool size and thus skeletal
muscle mass.42 Preclinical and
clinical studies demonstrate that
D3Cr dilution is a promising method
for the assessment of skeletal muscle
mass. A clinical validation study was
performed in both young and older
men and women in which D3Cr
muscle mass was strongly associated
with whole-body magnetic resonance
imaging (MRI) of muscle mass (r =
0.868, P < 0.0001), with less bias
compared with lean body mass
assessment by dual-energy x-ray
absorptiometry (DXA), which overestimated
muscle mass compared
with MRI.43 In the Health, Aging
and Body Composition (Health
ABC) study (2,292 participants aged
70-79), strength (grip or quadriceps)
but not lean mass (assessed by CT
cross-sectional area or DXA) was
associated with mortality, although
muscle mass (only lean mass and
CSA) was not measured.44 In the
Osteoporotic Fractures in Men
(MrOS) study in more than 1,300
older men (>80 years), men in the
lowest quartile of D3Cr muscle
mass/body mass had increased
mobility limitation and injurious
falls, worse physical performance,
and lower strength compared with
higher muscle mass, while these
associations were not seen with DXA
lean mass.45 Although additional
data is needed to demonstrate its
applicability in oncology, the D3-
creatine dilution method may
present an easily implementable
measure of muscle mass over time
and an alternative or companion to
radiologic measurement.
With increasing data
supporting the prognostic and
predictive roles of body composition
measures in patients with mRCC,
efforts at incorporating these findings
into existing and new models is of
interest. In the first of these studies,
a single institution retrospective
study of 79 patients with mRCC
treated with ICI-based regimens,
investigators analyzed baseline CT
images to investigate the association
between body composition and
clinical outcomes.46 They created a
body composition risk score in which
patients were classified as poor (0-
1), intermediate (2), or favorable
risk (3-4) based on measures of
skeletal muscle and adipose tissue,
demonstrating that the poor-risk
patients had significantly shorter
OS (HR: 6.37, p<0.001), PFS (HR:
4.19, p<0.001), and lower chance of
clinical benefit (OR: 0.23, p=0.044)
compared to favorable risk patients
in multivariable analysis. Patients
with low total fat index (TFI) had
significantly shorter OS (HR: 2.72,
p=0.002), PFS (HR: 1.91, p=0.025),
and lower chance of clinical benefit
(OR: 0.25, p=0.008) compared to
high TFI patients in multivariable
analysis. C-statistics were higher
for body composition risk groups
and TFI compared to IMDC and
BMI.46 While this study was limited
by its small size and heterogenous
patient population, it suggests the
potentially valuable prognostic and
predictive roles for radiologic body
composition measures in patients
with mRCC treated with modern
ICI-based regimens.
Skeletal muscle measurement, sarcopenia,
and sarcopenic obesity
While we commonly associate BMI
with adiposity, body mass also
includes muscle mass and thus
there has been interest in the role
that muscle mass and muscle loss
may play in the obesity paradox
in RCC (Table 1). Sarcopenia, a
decline in muscle mass, strength,
and conditioning, is known to be
common in patients with advanced
cancer and associated with worse
prognosis and has thus been of
interest in assessing outcomes of
patients with RCC.29
Clinical application and future
directions
BMI, while acknowledged as a
limited marker of body composition,
is easily captured and therefore,
widely utilized. Measurement of
body composition using radiologic
images, while more detailed and of
interest as described, is challenging
to translate into routine clinical
practice.
CONCLUSIONS
While available studies suggest
potentially important roles for
body composition measures, both
muscle and adipose tissue, in the
outcomes of patients with mRCC,
many questions remain unanswered
regarding their clinical applicability
and relevance to modern ICI-based
treatment regimens. As radiologic
measurement of body composition
and laboratory-based muscle mass
measurements become clinically
accessible, we increasingly will be
equipped to explore heterogeneity
and changes in body mass over
time and their potential role in
understanding and ultimately
influencing the outcomes of patients
with renal cell carcinoma.
REFERENCES
1. Adams KF, Leitzmann MF, Albanes D, et al. Body size and renal cell cancer incidence in a large US cohort study. American Journal of Epidemiology. 2008;168(3):268-277. 2. Renehan AG, Tyson M, Egger M, et al. Body-mass index and incidence of cancer: a systematic review and metaanalysis of prospective observational studies. Lancet. 2008;371(9612):569-578. 3. Wang F, Xu Y. Body mass index and risk of renal cell cancer: a doseresponse metaanalysis of published cohort studies. Int J Cancer. 2014;135(7):1673-1686. 4. Lauby-Secretan B, Scoccianti C, Loomis D, et al. Body fatness and cancer – viewpoint of the IARC Working Group. NEJM. 2016; 375:794-798. 5. Calle E and Kaaks R. Overweight, obesity and cancer: epidemiological evidence and proposed mechanisms. Nature Reviews Cancer. 2004;4:579-591. 6. Renehan A, Zwahlen M, Egger M. Adiposity and cancer risk: new mechanistic insights from epidemiology. Nature Reviews Cancer. 2015;15:484-498. 7. Kim LH, Doan P, He Y, et al. A systematic review and meta-analysis of the significance of body mass index on kidney cancer outcomes. J Urol. 2021;205(2):346-355. 8. Steffens S, Ringe KI, Schroeer K, et al. Does overweight influence the prognosis of renal cell carcinoma? Results of a multicenter study. Int J Urol. 2013;20(6):585-592. 9. Choi Y, Park B, Jeong BC, et al. Body mass index and survival in patients with renal cell carcinoma: a clinical-based cohort and metaanalysis. Int J Cancer. 2013;132(3):625-634. 10. Albiges L, Hakimi A, Xie W, et al. Body mass index and metastatic renal cell carcinoma: clinical and biological correlations. Journal of Clinical Oncology. 2016;34(30):3655-3663. 11. Lalani A, Bakouny Z, Farah S, et al. Assessment of immune checkpoint inhibitors and genomic alterations by body mass index in advanced renal cell carcinoma. JAMA Oncology. 2021;7(5):773-775. 12. Dizman N, Bergerot P, Bergerot C, et al. Comparative effect of bodymass index on outcome with targeted therapy and immunotherapy in patients with metastatic renal cell carcinoma (mRCC). Annals of Oncology. 2018; 29(supp 8):viii318. 13. Boi SK, Orlandella RM, Gibson JT, et al. Obesity diminishes response to PD-1-based immunotherapies in renal cancer. JITC. 2020;8(2): e000725. 14. De Giorgi U, Procopio G, Giannarelli D, et al. Association of Systemic Inflammation Index and Body Mass Index with Survival in Patients with Renal Cell Cancer Treated with Nivolumab. Clin. Cancer Res. 2019;25:3839–3846. 15. Bergerot P, Bergerot C, Philip E, et al. Targeted therapy and immunotherapy: effect of body mass index on clinical outcomes in patients diagnosed with metastatic renal cell carcinoma. Kidney Cancer. 2019;3(1): 63-70. 16. Ged Y, Lee C-H, Sanchez A, et al. Association of body mass index (BMI) with clinical outcomes in 203 metastatic ccRCC patients (pts) treated with immuno-oncology (IO) agents. Journal of Clinical Oncology. 2019;37(15_suppl):e16103-e16103. 17. Sanchez A, Furberg H, Kuo F, et al. Transcriptomic signatures related to the obesity paradox in patients with clear cell renal cell carcinoma: a cohort study. Lancet Oncol. 2020;21(2):283-293. 18. Kotecha R. Mechanistic insights into the obesity paradox and implications for therapy. Kidney Cancer Journal. 2020;18(3):77-82. 19. Park Y, Peterson LL, and Colditz GA. The plausibility of obesity paradox in cancer. Cancer Research. 2018;78(8):1898-1903. 20. Shen W, Punyanitya M, Wang Z, et al. Total body skeletal muscle and adipose tissue volumes: estimation from a single abdominal crosssectional image. J Appl Physiol. 2004;97:2333-2338. 21. Shen W, Punyanitya M, Wang Z, et al. Visceral adipose tissue: relations between single-slice areas and total volume. Am J Clin Nutr; 2004;80:271-278. 22. Prado CM, Birdsell LA and Baracos VE. The emerging role of computerized tomography in assessing cancer cachexia. Current Opinion in Supportive and Palliative Care. 2009;3:269-275. 23. Feliciano EM, Popuri K, Cobzas D, et al. Evaluation of automated computed tomography segmentation to assess body composition and mortality associations in cancer patients. Journal of Cachexia, Sarcopenia, and Muscle. 2020;11(5):1258-1269. 24. Ibrahim MM. Subcutaneous and visceral adipose tissue: structural and functional differences. Obes Rev. 2010;11:11–8. 25. Mano R, Hakimi AA, Zabor EC, et al. Association between visceral and subcutaneous adiposity and clinicopathological outcomes in nonmetastatic ccRCC. Can Urol Assoc J. 2014;8(9-10):E675-E680. 26. Mizuno R, Miyajima A, Hibi T, et al. Impact of baseline visceral fat accumulation on prognosis in patients with metastatic renal cell carcinoma treated with systemic therapy. Med. Oncol. 2017;34:47. 27. Steffens S, Grunwald V, Ringe K, et al. Does Obesity Influence the Prognosis of Metastatic Renal Cell Carcinoma in Patients Treated with Vascular Endothelial Growth Factor– Targeted Therapy? The Oncologist. 2011;16(11):1565-1571. 28. Ladoire S, Bonnetain F, Gauthier M, et al. Visceral fat area as a new independent predictive factor of survival in patients with metastatic renal cell carcinoma treated with antiangiogenic agents. Oncologist. 2011;16:71–81. 29. Martin L, Birdsell L, MacDonald N, et al. Cancer cachexia in the age of obesity: skeletal muscle depletion is a powerful prognostic factor, independent of body mass index. Journal of Clinical Oncology. 2013;31:1539-1547. 30. Prado C, Lieffers J, McCargar L, et al. Prevalence and clinical implications of sarcopenic obesity in patients with solid tumours of the respiratory and gastrointestinal tracts: a populationbased study. Lancet Oncology. 2008; 9(7):629-635. 31. Psutka S, Boorjian S, Moynagh M, et al. Decreased skeletal muscle mass is associated with an increased risk of mortality after radical nephrectomy for localized renal cell cancer. J Urol. 2016;195(2):270-6. 32. Sharma P, Zargar-Shoshtari K, Caracciolo J, et al. Sarcopenia as a predictor of overall survival after cytoreductive nephrectomy for metastatic renal cell carcinoma. Urol Oncol. 2015;33(8):339.e17-23. 33. Fukushima H, Nakanishi Y, Kataoka M, et al. Prognostic significance of sarcopenia in patients with metastatic renal cell carcinoma. J Urol. 2016;195(1):26-32. 34. Antoun S, Birdsell L, Sawyer MB, et al. Association of skeletal muscle wasting with treatment with sorafenib in patients with advanced renal cell carcinoma: results from a placebocontrolled study. Journal of Clinical Oncology. 2010;28(6):1054-60. 35. Gu W, Wu J, Liu X, et al. Early skeletal muscle loss during target therapy is a prognostic biomarker in metastatic renal cell carcinoma patients. Scientific Reports. 2017;7:7587. 36. Auclin E, Bourillon C, De Maio E, et al. Prediction of Everolimus Toxicity and Prognostic Value of Skeletal Muscle Index in Patients With mRCC. Clinical Genitourinary Cancer. 2017;15(3):350-355. 37. Cortellini A, Bozzetti F, Palumbo P, et al. Weighing the role of skeletal muscle mass and muscle density in cancer patients receiving PD-1/PD-L1 checkpoint inhibitors: a multicenter real-life study. Scientific Reports. 2020;10:1456. 38. Baracos VE and Arribas L. Sarcopenic obesity: hidden muscle wasting and its impact for survival and complications of cancer therapy. Annals of Oncology 2018; ii1-ii9. 39. Heidelberger V, Goldwasser F, Kramkimel N, et al: Sarcopenic overweight is associated with early acute limiting toxicity of anti-PD1 checkpoint inhibitors in melanoma patients. Invest New Drugs. 2017; 35:436-441. 40. Cespedes Feliciano E, Avrutin E, Caan B, et al. Screening for low muscularity in colorectal cancer patients: a valid, clinic-friendly approach that predicts mortality. J Cachexia Sarcopenia Muscle. 2018;9(5):898-908. 41. Roeland E, Bohlke K, Baracos V, et al. Management of cancer cachexia: ASCO Guideline. JCO. 2020; 38(21): 2438-2453. 42. Shankaran M, Czerwieniec G, Fessler C, et al. Dilution of oral D3 -Creatine to measure creatine pool size and estimate skeletal muscle mass: development of a correction algorithm. J Cachexia Sarcopenia Muscle. 2018;9:540-546. 43. Clark RV, Walker AC, O'Connor- Semmes RL, et al. Total body skeletal muscle mass: estimation by creatine (methyl-d3) dilution in humans. J Appl Physiol (1985) 2014;116:1605-13. 44. Newman AB, Kupelian V, Visser M, et al. Strength, but not muscle mass, is associated with mortality in the health, aging and body composition study cohort. J Gerontol A Biol Sci Med Sci. 2006;61:72-77. 45. Cawthon PM, Orwoll ES, Peters KE, et al. Strong Relation between Muscle Mass Determined by D3-creatine Dilution, Physical Performance and Incidence of Falls and Mobility Limitations in a Prospective Cohort of Older Men. J Gerontol A Biol Sci Med Sci. 2019;74(6):844-852. 46. Martini D, Anders Olsen T, Goyal S, et al. Body Composition Variables as Radiographic Biomarkers of Clinical Outcomes in Metastatic Renal Cell Carcinoma Patients Receiving Immune Checkpoint Inhibitors. Front Oncol. 2021 11:707050.Correspondence to: Hannah Dzimitrowicz, MD Department of Medicine, Duke University School of Medicine, Durham, NC, USA
Email: hannah.dzimitrowicz@duke.edu