Submitted - November 30, 2021 | Revised - December 14, 2021 | Accepted - December 12, 2021 | ePublished - December 17, 2021
DOI: https://doi.org/10.52733/KCJ19n4-a1
Radiological Correlates of pT3a Kidney Cancer: Importance of Irregular Tumor Sinus Border
Yunlin Yea,b*, Diego Aguilar Palaciosa*, Rebecca A. Campbella*, Alain G. Rizkc, Hajime Tanakaa, Carlos Munoz Lopeza, Emily Abramczyka, Gustavo Roversia, Jianbo Lid, Christopher J.Weighta, Robert Abouassalya , Erick M. Remera,c, and Steven C. Campbella.a. Glickman Urological and Kidney Institute, Cleveland Clinic, Cleveland, OH
b. Department of Urology Sun Yat-Sen University Cancer Center, State Key Laboratory of Oncology in South China, Collaborative Innovation Center for Cancer Medicine, Guangzhou, China
c. Imaging Institute, Cleveland Clinic, Cleveland, OH
d. Department of Quantitative Health Sciences, Cleveland Clinic, Cleveland, OH, USA.
* Drs. Ye, Aguilar Palacios, and RA Campbell contributed fully and equally to this work.
CORRESPONDENCE: Steven C. Campbell. Email: campbes3@ccf.org
ABSTRACT
Purpose: Preoperative assessment of T3a renal cell carcinoma (RCC) in absence of main renal vein involvement or lymph node enlargement is challenging but has potential implications for counseling and prognosis.
Materials and Methods: A retrospective review of 1129 cT1-T3aN0M0 RCC patients managed with partial/radical nephrectomy (PN/RN) in our institution (2012-2014) was performed. Exclusion criteria included radiological evidence of main renal vein involvement or substantial lymphadenopathy. Eleven radiological findings suggestive of aggressive tumor biology or invasive phenotype based on prior literature were assessed for correlation with pT3a status. These included perinephric findings (stranding, enhancing nodule, collateral vessels, or irregular perinephric tumor contour), findings within the sinus (stranding, collecting system invasion, branch vein enlargement, or irregular tumor sinus border [ITSB]), and tumor necrosis, infiltrative features, and tumor size. Radiological assessment was blinded to final pathology. Sensitivity/specificity and logistic regression analyses assessed the performance of each imaging finding for detecting pT3a tumors.
Results: Median tumor size was 4.0cm and R.E.N.A.L. was 8. Median follow-up was 53 months (IQR:28-64). pT3a tumors were found in 281 patients (25%) and strongly correlated with local and systemic recurrence (p<0.02). ITSB was found in 350 patients (31%) and was the strongest predictor of pT3a status. Sensitivity/specificity/PPV/NPV/OR/C-Index for ITSB were 75%/84%/61%/91%/15.8(11.4-21.9)/0.80, for correlation with pT3a, respectively. The best predictive model included ITSB (yes/no) and tumor size as a continuous variable (C-index=0.84). Addition of other imaging findings did not improve the model (C-index=0.84). ITSB was the strongest contributor in all multivariable models and also strongly correlated with recurrence free survival. Inter/intra-observer correlations for assessment of ITSB were 0.89/0.98, respectively.
Conclusion:Our data suggest that ITSB and tumor-size associate with pT3a RCC, which could impact patient counseling.
INTRODUCTION
Pathologic T3a (pT3a) status for renal cell carcinoma (RCC) is defined by American Joint Commission on Cancer as tumor extension into the renal vein or its segmental branches, invasion into the collecting system, or extension into the perirenal and/or renal sinus fat but limited to Gerota fascia1. Five-year recurrence-free survival (RFS) for patients with pT3a tumors is about 70-80%, substantially reduced when compared to those with organ confined tumors2. Some reports suggest worse outcomes for pT3a tumors when managed with partial nephrectomy (PN) rather than radical nephrectomy (RN), although most studies suggest otherwise3–7 and both are options according to national/international guideline8,9.
Upstaging of clinical T1-2 (cT1-2) tumors to pT3a occurs in approximately 5-15% of cases2–6 and has correlated with reduced recurrence-free and cancer-specific survival (CSS); however, it is difficult to identify such patients preoperatively10. Pathologic features including tumor size, clear cell histology, higher Fuhrman grade (3-4) and positive surgical margins have all associated with upstaging, but much of this information is not available until after surgery, and it is notable that imaging features were not incorporated into these analyses11–14. Traditionally, perinephric stranding or presence of an isolated, enhancing perinephric nodule were considered indicative of pT3a disease, but the former is non-specific and the latter, while having high positive predictive value, is uncommon2,15–17.
In this study we provide a comprehensive analysis of radiological findings that might correlate with pT3a status, including potential indicators of aggressive tumor biology (e.g. tumor size, infiltrative features, or presence of necrosis or collateral vessels) or signs of locally-invasive phenotype (e.g. involvement of the collecting system or branch veins). Recent studies with restricted numbers of patients or other limitations, suggest that irregular tumor contour may correlate with advanced pathology for RCC and we have also incorporated this into our analysis18–20. Our study population includes a large cohort of cT1-T3a patients excluding only those with obvious locally-advanced tumors, such as those clearly involving the main renal vein or exhibiting concerning lymphadenopathy. Our objective is to facilitate more accurate prediction of pT3a status and thus improve patient counseling prior to surgery for RC8,21.
2. MATERIALS AND METHODS
2.1. Study participants
After approval from our institutional review board, a retrospective review was performed of all patients who underwent PN/RN at our institution for RCC (2012-2014) ( Supplementary Figure 1 ). Availability of preoperative cross-sectional, contrast-enhanced imaging studies was required. All studies were reviewed to identify cT1-T3aN0M0 RCC cases without main renal vein involvement or substantial lymphadenopathy (total ipsilateral or interaortocaval retroperitoneal lymph-node burden>1.5cm). Demographics, tumor/pathologic characteristics, and clinical outcomes were obtained by retrospective chart review.
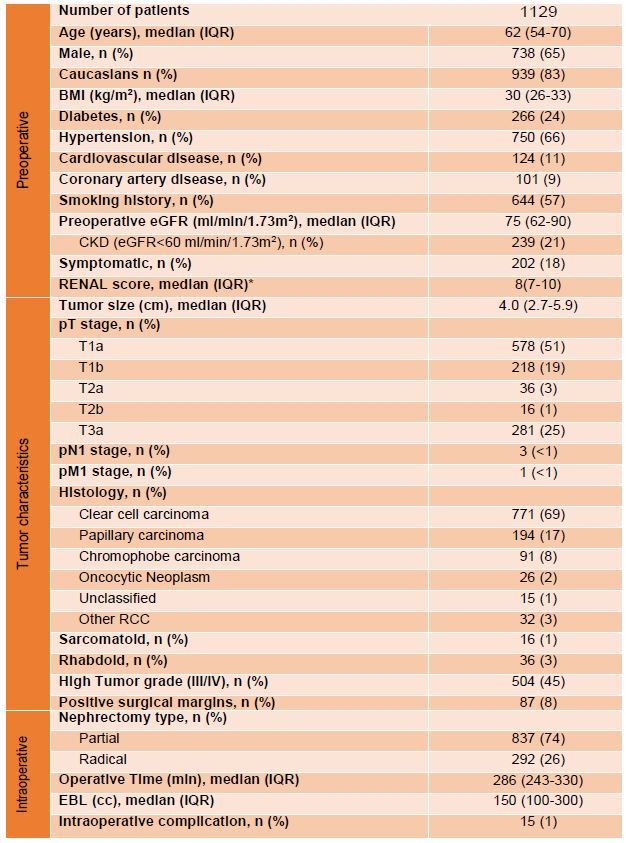
Table 1. Demographics, tumor characteristics and perioperative outcomes. Abbreviations: BMI=body mass index; CKD=chronic kidney disease; EBL=estimated blood loss; eGFR=estimated glomerular filtration rate; IQR=Interquartile range; R.E.N.A.L. = (R)adius (tumor size as maximal diameter), (E)xophytic/endophytic properties of tumor, (N)earness of tumor deepest portion to collecting system or sinus, (A)nterior(a)/posterior (p) descriptor, and (L)ocation relative to polar lines. *only available for 442 patients
2.2 Endpoints and imaging review
Primary endpoint was correlation of radiological findings with pT3a. Radiological findings were chosen for this analysis if they were suggestive of aggressive tumor phenotype or local invasion or were previously implicated in the literature as being correlated with pT3a status. Preoperative imaging studies (CT or MRI) were reviewed in both corticomedullary/nephrographic phases in blinded fashion. Imaging findings included perinephric features (extensive stranding, isolated enhancing nodule in perinephric space, collateral vessels, or irregular perinephric tumor contour), findings within the sinus (extensive stranding, collecting system invasion, branch vein enlargement or filling defect, or irregular tumor sinus border [ITSB]), tumor necrosis22,23, infiltrative features,24,25 and tumor size ( Figure 1). ITSB was defined as non-spherical or non-elliptical contour for tumor extending into the renal sinus. Any perceived irregularity in tumor contour within the sinus was classified as ITSB. Figure 2 provides examples of cases that were negative or positive for ITSB.
After preliminary group review of several cases to develop common perspectives, all imaging was reviewed by a radiology fellow (AGR), a urology resident (DAP) and an urologist (YY) and all equivocal findings were also reviewed with both EMR and SCC, staff radiologist and urologist, respectively, to reach consensus. Each radiological finding was assessed as a dichotomized parameter and evaluated for sensitivity/specificity, and C-index relative to pT3a status. If more than one radiological finding was present for a tumor, each was independently included in the analysis. Secondary outcomes included total, local, and systemic RFS from the date of surgery. Intra-observer correlation for ITSB status was determined by repeat blinded review of 50 randomly selected cases. Inter-observer correlation for ITSB-status was assessed by independent and blinded review of 250 randomly selected cases.
2.3. Statistical Analysis
Tumor size was examined both as a continuous and categorical variable. All other parameters were evaluated as dichotomized variables. For each imaging finding the sensitivity, specificity, and concordance-index (C-index) with pT3a status were determined. Multivariable predictive models combining ITSB and other radiological findings were developed using logistic regression analysis and in each instance the C-index and its 95% confidence interval (CI) were determined. Odds ratio (OR) and 95% CI were also estimated for each variable. The 95% CIs were determined by 1000 bootstrap resampling. Multiple nomograms were created with ITSB and tumor size as the base with inclusion of other radiological findings based on multivariable logistic regression models. Kaplan-Meier was used to estimate recurrence-free survival and Log Rank test to compare the survival curves. Statistical analyses were done using R (www.r-project.org).
3. RESULTS
3.1. Patient demographics/tumor characteristics
A total of 1129 RCC patients managed with PN/RN with cT1-T3aN0M0 tumor (excluding only those with main renal vein involvement or substantial lymphadenopathy) were analyzed. Demographic/tumor characteristics were representative for such a patient population ( Table 1).
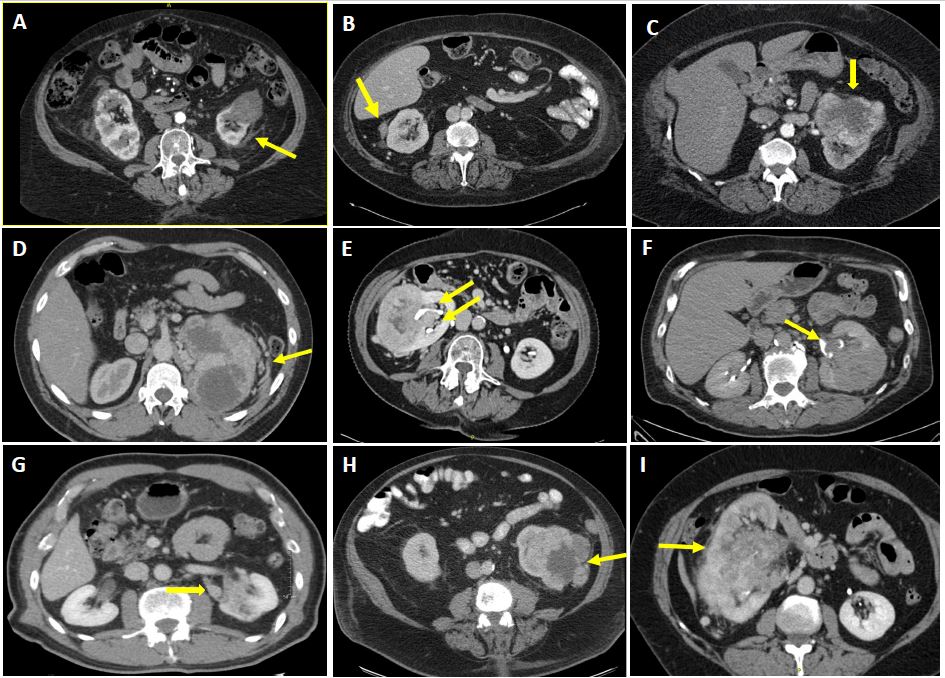
Figure 1. Representative images from pre-operative CT for patients with cT1-T3a renal cell carcinoma demonstrating various imaging findings with possible correlation to pT3a status. Arrows point to relevant findings, including: A) Perinephric stranding; B) Enhancing nodule in the perinephric space; C) Irregular tumor contour in the perinephric space; D) Collateral vessels in perinephric space; E) Irregular tumor sinus border (ITSB); F) Collecting system invasion; G) Branch vein involvement; H) Tumor necrosis; and I) Infiltrative features. Some tumors exhibited more than one of these features and when this was the case all such features were recorded as positive for analysis. Branch vein involvement was suspected whenever there was apparent filling defect or enlargement or soft tissue enhancement within a branch vein not extending into the main renal vein.
Median patient age was 62 years, 65% were male, and 83% Caucasian. Median tumor size was 4.0 cm and median R.E.N.A.L. score was 8. pT3a tumors were found in 281 patients (25%), while the remaining 848 (75%) were pT1-2. High tumor grade (3/4) was observed in 504 patients (45%). Tumor histology included 69% clear cell carcinoma, 17% papillary, 8% chromophobe, and 2% oncocytic neoplasm. Median follow-up was 53 months (IQR:28-64 months). pT3a tumors had significantly worse 5-year RFS compared to pT1-2, at both the local and systemic levels (p=0.011 and p<0.001, respectively)( Figure 3).

Figure 2. Comparison of CT images of renal tumors illustrating absence versus presence of irregular tumor sinus border (ITSB), including coronal (A-C) and axial (D-F) images. ITSB was defined based on assessment of the tumor contour in the renal sinus, and was considered positive if this was non-spherical or non-elliptical. A) Smooth, round tumor extending into the renal sinus and negative for ITSB; B) Tumor with irregular border in sinus, positive for ITSB; C) Readilyevident irregular tumor border in sinus; D) Tumor with irregular medial border not extending to renal sinus, so negative for ITSB; E) Tumor with irregular tumor border in sinus, positive for ITSB; F) Tumor with markedly irregular sinus border. In summary, any perceived irregularity in the contour of the tumor within the sinus was classified as ITSB.
3.2. Correlation of imaging features with pT3a status
ITSB was found in 350 patients (31%), including 61% of pT3a patients, and proved to be the strongest predictor of pT3a (C-index=0.80, Table 2). Sensitivity/specificity/positive predictive value (PPV)/negative predictive value (NPV)/OR (95% CI) for correlation of ITSB with pT3a were 75%/84%/61%/91%/15.8(11.4-21.9), respectively. ITSB also strongly correlated with RFS [hazards ratio(HR)(95% CI):5.51(3.61-8.41)] ( Figure 3D). Interobserver and intraobserver correlations for imaging review of ITSB were 0.89/0.98, respectively. Other than ITSB, tumor size had the next highest C-index of 0.76 ( Table 2). All other imaging features demonstrated high specificity (≥0.92) but relatively low sensitivity (all <0.35) and suboptimal concordance-indices (C-indices all 0.51-0.63, Table 2).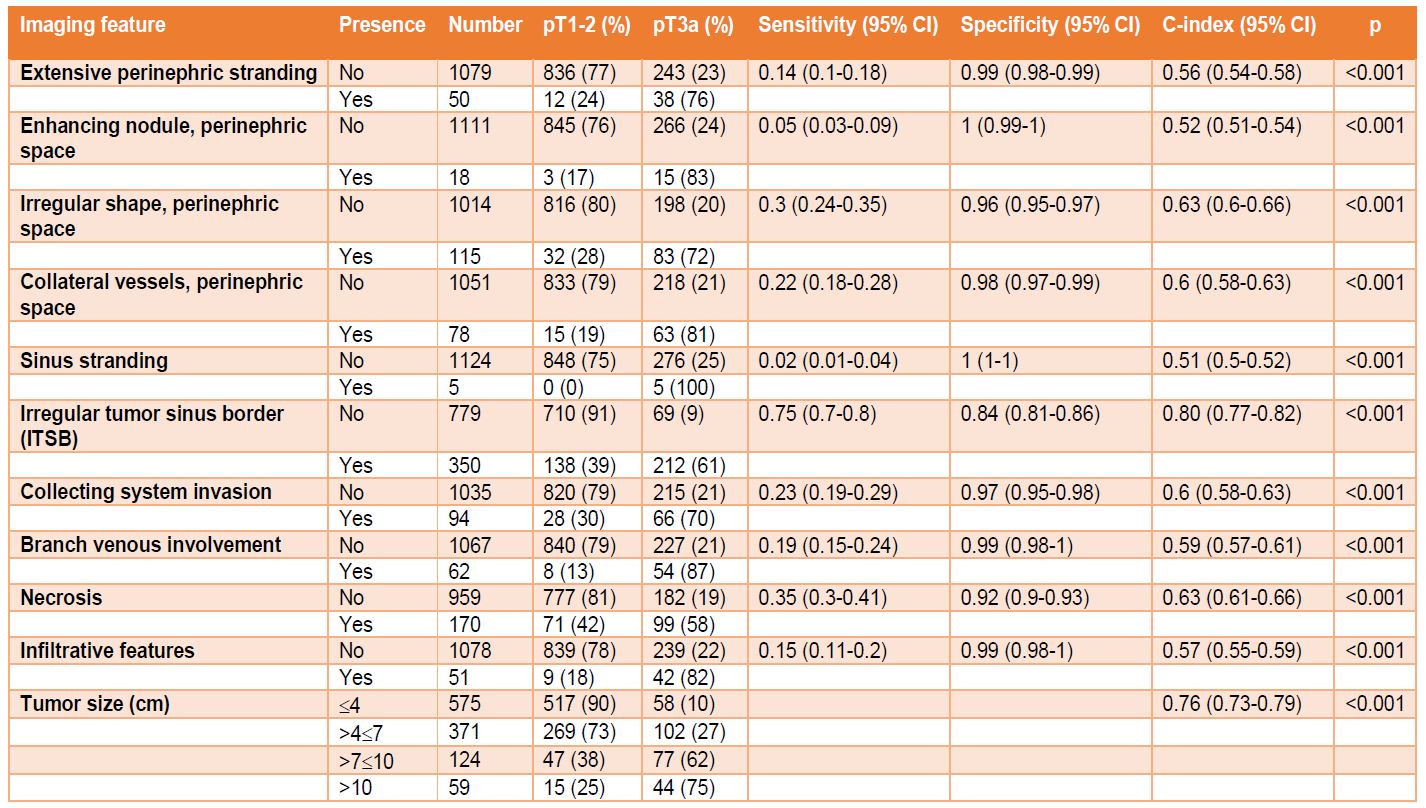
Table 2. Relationship between imaging features and pathological stage. Abbreviations: CI = confidence interval. Note: Sensitivity, specificity and C-index and their 95% CIs are based on 1000 bootstrap resampling.
3.3. Multivariable models to predict pT3a
Two-variable models were then explored with ITSB as the foundation to determine if the predictive value could be improved. Tumor size as a categorical variable improved the C-index to 0.83, compared to a C-index of 0.80 for ITSB alone ( Supplementary Table 1). In multivariable models using ITSB, categorical tumor size, and a third variable, addition of the third imaging feature did not improve the model, with the C-index remaining at 0.83 ( Supplementary Table 2).
The best predictive nomogram for pT3a included ITSB(yes/no) and tumor size as a continuous variable (C-index=0.84, Figure 4). Addition of other imaging features to develop an optimal nomogram did not improve the model (C-index remained 0.84, Supplementary Figure 2). ITSB was the most robust contributor in all models.

Figure 3. Kaplan-Meier curves comparing recurrence-free survival (RFS) after renal cancer surgery under various conditions, including: A) Local RFS for pT1-2 versus pT3a tumors; B) Systemic RFS for pT1-2 versus pT3a tumors; C) Total RFS for pT1-2 versus pT3a tumors (RFS at 5 years 94% and 70%, respectively); D) Total RFS for ITSB versus no ITSB (RFS at 5 years 94% and 74%, respectively). ITSB = irregular tumor sinus border. Overall, a total of 41 local recurrences were observed, with 17 in the pT3a cohort (n=281) and 24 in the pT1-2 cohort (n=848). Overall, a total of 79 systemic recurrences were observed, with 59 in the pT3a cohort (n=281) and 20 in the pT1-2 cohort (n=848). Eighteen patients had both local and systemic recurrences. Overall, a total of 65 patients in the pT3a cohort experienced recurrence and 37 pT1-2 patients recurred. A total of 71 ITSB positive patients recurred (n=350) and 31 patients without ITSB recurred (n=779). Local recurrence was defined as recurrence in the ipsilateral kidney or retroperitoneum and systemic recurrence as any recurrence outside of the ipsilateral retroperitoneum.
4. DISCUSSION
pT3a status for RCC correlates with worse prognosis compared to pT1-2 but is difficult to identify preoperatively.2,10,14 Previous studies analyzed associations between demographics, laboratory values, or pathologic factors and pT3a; however, many of these factors are only available postoperatively and the observed correlations have been modest and of limited clinical utility11,14. Our analysis focuses on several imaging-features that suggest aggressive or invasive tumor biology and evaluates their potential correlation with pT3a status. Our study population includes all cT1-T3a patients excluding only those with obvious locally-advanced tumors, such as those clearly involving the main renal vein or exhibiting substantial lymphadenopathy, to provide as robust of an analysis as possible. We purposely did not classify our patient population as cT1-2 versus cT3a, as criteria for doing this are not well-established and our main objective was to determine what features would allow for such differentiation. The recent literature suggests that tumor contour may be a predictive factor for RCC and this characteristic was also prioritized in our analysis18–20,26.
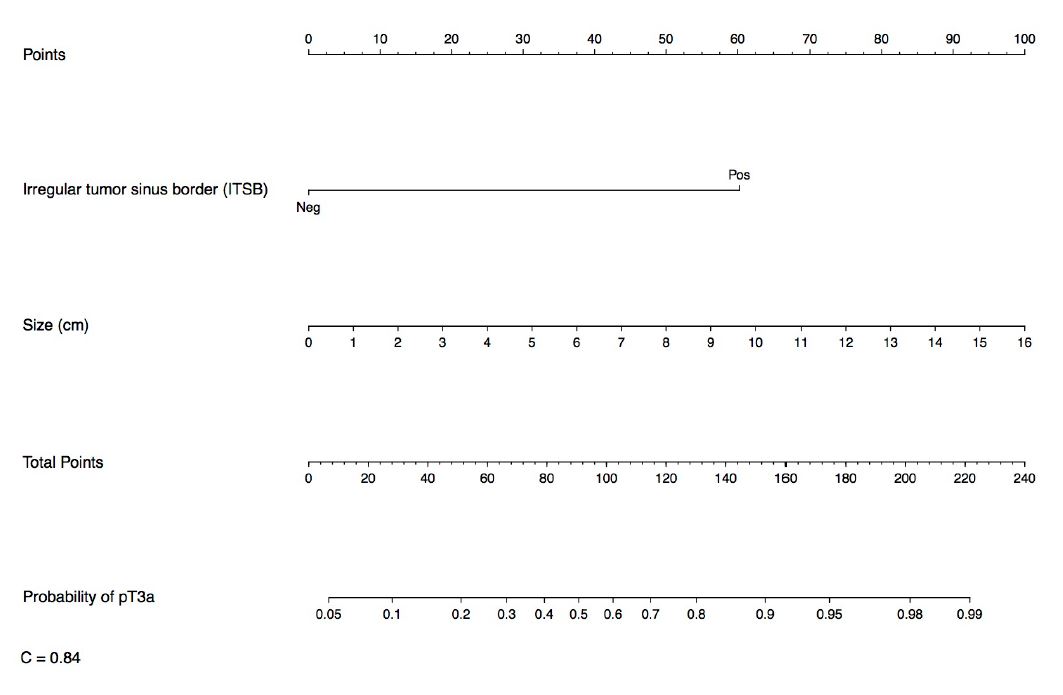
Figure 4. Nomogram for prediction of pT3a status based on pre-operative imaging characteristics. This simple algorithm provided a C-index of 0.84.
We found that pT3a was present in 25% of cT1-T3a cases and strongly associated with both local and systemic recurrence. Irregular tumor sinus border (ITSB) was present in 31% of cases and was the strongest predictor of pT3a status in all models tested. Although somewhat subjective - a limitation of many radiologic findings - assessment of ITSB proved to be reproducible. Tumor size as a continuous variable had the second highest predictive value and has the benefit of being highly objective. When tumor size was combined with ITSB the predictive value was strengthened (C-index improved to 0.84), yet addition of other imaging characteristics failed to improve the predictive capacity.
Previous studies have similarly identified irregular tumor contour as a potential predictor of pT3a, although most such studies had significant limitations. Bolster studied 55 RCC cases and found that irregular tumor contour within the sinus had 84% sensitivity for pT3a, and the correlation was significant (p<0.001)18. Another study with 863 patients evaluated the ability of multi-detector CT to predict renal sinus fat-invasion and found four significant predictors on multivariate analysis, including ITSB (OR 6.83, p<0.0001), tumor size greater than 5 cm (OR=7.29, p<0.0001), decreased perfusion of the diseased kidney (OR=2.31, p=0.018), and lymph-node metastasis (OR=2.97, p=0.016)26. However, there were only 118 pT3a tumors in this cohort, and many potentially important imaging findings, such as infiltrative features, were not analyzed. Ni studied 60 patients with pT3a RCC and on multivariate analysis, ITSB again proved to be an independent risk factor for renal sinus fat invasion (p<0.001)19. Based on these reports and our study, which is the largest and most comprehensive to address this topic, irregular tumor contour appears to be a promising predictor of local invasiveness for RCC.
Tumor size has also consistently shown strong predictive value for pT3a in the literature and our study supports this11,27,28. A recent meta-analysis by Veccia that examined over 20,000 patients with cT1 RCC, including 1,256 upstaged to pT3a (5.7%), found increasing tumor size to be significantly associated with pT3a (p<0.001)13. Another study examining the staging accuracy of CT for pT3a found that pT3a tumors were significantly larger than pT1-2 tumors (median 8.0cm vs. 4.5cm, respectively; p=0.002)20. This is not surprising given previous reports demonstrating strong association between tumor size and aggressive tumor biology for RCC29. Previous studies have shown that upstaging from cT1-2 to pT3a occurs in about 5-15% of cases and most suggest that outcomes for upstaged patients are similar when managed with PN or RN2–7. Weight examined 2,511 patients with cT1 RCC and found no difference in overall survival or CSS for patients upstaged to pT3a treated with PN versus RN6. Similarly, a recent multi-center analysis (n=2,573) found upstaging from cT1-2 to pT3a in 14% of patients and reported that type of surgery (PN vs. RN) was not associated with risk of recurrence5. Conversely, Shah, et al. examined 1,250 patients with cT1 disease of which 11% were upstaged to pT3a and found that upstaged cases treated with PN had worse RFS compared to those managed with RN (HR=5.39, p=0.001)3. Although most recent data suggest that cT1-2 tumors upstaged to pT3a can do well with PN, the Shah study serves as a reminder that this is still somewhat controversial.
Our study population differs from those that evaluate pT3a specifically upstaged from cT1-2 in that we did not exclude cT3a patients, except those with obvious locally advanced disease. This likely accounts for our substantially higher incidence of pT3a tumors (25%). Our study design allows us to provide a more comprehensive analysis of imaging features that correlate with pT3a, rather than solely focusing on predictors for upstaging from cT1-2. Studies focused on upstaging from clinically confined to pT3a likely select for patients with microscopic renal sinus or perinephric fat invasion, as more substantial invasion would be suspicious for cT3a and thus more likely to be excluded. In these scenarios, PN could offer equivalent oncologic benefits as RN, as most recent studies have suggested. On the other hand, there are undoubtedly some pT3a patients who would be at risk for poor oncologic outcomes with PN and for whom preoperative identification of T3a status could be important by tipping the balance in favor of RN8,9,21. Further studies will be required to examine the potential predictive value of ITSB, and other factors, specifically in the cT1-2 population.
In addition to tumor size and ITSB, nine other imaging features were examined for correlation with pT3a, with most chosen because they had previously demonstrated correlation with pT3a status or were indicative of local-invasion or aggressive tumor biology15–17,28. We found that all of these variables were significantly associated with pT3a and demonstrated high specificity; however, low sensitivity and low concordance indices limited their utility, and none of these factors complemented ITSB and tumor size in multivariable models.
In a similar but much smaller study, Sokhi and colleagues examined a multitude of CT findings in 117 patients with pT1-T3a RCC to determine predictors of pT3a, including: tumor necrosis; tumor edge extending to the renal sinus or perirenal fascia; irregularity of tumor contour; accentuated perinephric septa; perinephric stranding; thickening of the perirenal fascia; increased perinephric vascularity; perinephric nodules; and calcification20. Most of these variables, some of which overlap those studied in our analysis, were significantly associated with pT3a; however, many were not clinically useful due to poor interobserver agreement. The most useful predictors of pT3a status appeared to be tumor necrosis, irregular tumor contour, and direct contact between tumor and perirenal fascia or renal sinus fat (OR=2.5-3.7; p<0.05).
Another recent study by Nocera examined 236 patients with cT1 clear cell RCC and developed a model for predicting pT3a at nephrectomy which included age, tumor size, rim location, exophytic position, and polar involvement. pT3a was present in 10.6% of their patients and the accuracy of the model was 81%30. Other studies suggest that R.E.N.A.L. nephrometry score and hilar location may also correlate with pT3a status12,13. While our analysis provides a comprehensive and blinded evaluation of imaging features and their correlation with pT3a status in a substantial cohort of patients, it is possible that demographic features, laboratory results, or findings from renal mass biopsy might complement ITSB and tumor size and provide an even more accurate preoperative assessment11–14. Further studies will be needed to explore these possibilities, and given the retrospective and single-institution nature of our study, independent validation will also be required. Additionally, because our data were generated from a cohort of cT1-cT3a patients, our results may lack generalizability to the more restricted cT1-2 population and this will also require further investigation. While our analysis examined ITSB and pT3a status, specific aspects of pT3a status, such as renal sinus versus perinephric fat invasion, were not assessed individually. Future studies could examine the correlation between ITSB and various cohorts of pT3a, which might be informative. Finally, it could be argued that ITSB is somewhat subjective, although this is a limitation of many other radiologic findings, and our evaluation of this parameter demonstrated strong intra and interobserver reproducibility. In the future, artificial intelligence may further improve this assessment by implementing automatic contouring and recognition.
5. CONCLUSION
ITSB and tumor size are readily available and reproducible preoperative imaging findings that can be used to more accurately predict pT3a RCC and thus potentially improve patient counseling. Future studies will be required to externally validate and further explore our findings, including associations between ITSB and specific pathologic findings that qualify a given tumor as pT3a.
SUPPLEMENTAL INFORMATION
DISCLOSURE
None of the authors have any disclosures or conflicts of interest to report.
Abbreviations
AUTHOR CONTRIBUTIONS
Ye, Yunlin: Developed concept and hypothesis, contributed data collection and analysis; performed the analyses, helped write manuscript, review and revision of manuscript;
Aguilar Palcios, Diego: Developed concept and hypothesis, contributed data collection and analysis; performed the analyses, helped write manuscript, review and revision of manuscript;
Campbell, Rebecca: Developed concept and hypothesis, contributed data collection and analysis, performed the analyses, helped write manuscript, review and revision of manuscript;
Rizk, Alain G: Contributed to data collection, review and revision of manuscript;
Tanaka, H: Contributed to data collection, review and revision of manuscript;
Munoz-Lopez, Carlos: Contributed to data collection, review and revision of manuscript;
Abramczyk, Emily: Contributed to data collection, review and revision of manuscript;
Roversi, Gustavo: Contributed to data collection, review and revision of manuscript;
Li, Jianbo: Data and statistical analysis, writing of manuscript, review and revision of manuscript;
Weight, Christopher J: Developed concept and hypothesis, review and revision of manuscript;
Abouasally, Robert: Developed concept and hypothesis, review and revision of manuscript;
Remer, Erick M, Developed concept and hypothesis, review and revision of manuscript, also helped with data collection;
Campbell, Steven C.: all above activities.