Received on 29 September 2021. Accepted for Publication on 11 October 2021. Available Online 13 October 2021
Tissue based biomarkers in non-clear cell RCC:
Correlative analysis from the ASPEN clinical trial
Susan Halabi, PhD1Qian Yang1, Andrea Carmack, MB1, Shiqi Zhang1, Wen-Chi Foo1,Tim Eisen, MD2, Walter M. Stadler, MD3, Robert
J. Jones MD,4, Jorge A. Garcia MD5, Ulka N. Vaishampayan MD6, Joel Picus MD7, Robert E. Hawkins MD8, John D. Hainsworth MD8, Christian K. Kollmannsberger MD10, Theodore F. Logan MD1111, Igor Puzanov MD1212, Lisa M. Pickering MD1313, Christopher W. Ryan
MD14,Andrew Protheroe MD15/, Daniel J. George MD16, Andrew J. Armstrong MD16*,
1. Department of Biostatistics and Bioinformatics, Duke University, Durham NC;
2. University of Cambridge, Cambridge, United Kingdom;
3. University of Chicago, Chicago, IL USA;
4. University of Glasgow, The Beatson West of Scotland Cancer Centre, Glasgow, United Kingdom;
5. Cleveland Clinic, Cleveland, OH USA; S
6. University of Mic higan, Ann Arbor/Karmanos Cancer Institute, Wayne State University, Detroit, MI USA;
7. Washington University in St. Louis, St. Louis, MO USA;
8. Christie Cancer Research Centre, Manchester, United Kingdom;
9. Sarah Cannon Research Institute, Nashville, TN USA;
10. BC Cancer Agency, Vancouver Cancer Centre, Vancouver, BC Canada;
11. Indiana University Melvin and Bren Simon Cancer Center, Indianapolis, IN USA;
12. Vanderbilt University Medical Center, Nashville, TN USA;
13. Royal Marsden Hospital, London, United Kingdom;
14. Oregon Health & Science University, OHSU Knight Cancer Institute, Portland, OR USA;
15. University of Oxford Medical Oncology Department, Oxford, United Kingdom;
16. Duke University and the Duke Cancer Institute Center for Prostate and Urologic Cancers, Durham, NC;
Correspondence to: Email: andrew.armstrong@duke.edu.
ABSTRACT
Biomarkers are needed in patients with non-clear cell renal cell carcinomas
(NC-RCC), particularly papillary renal cell carcinoma, in order to inform
on initial treatment selection and identify potentially novel targets for
therapy. We enrolled 108 patients in ASPEN, an international randomized
open-label phase 2 trial of patients with metastatic papillary, chromophobe, or
unclassified NC-RCC treated with the mTOR inhibitor everolimus (n=57) or the
vascular endothelial growth factor (VEGF) receptor inhibitor sunitinib (n=51),
stratified by MSKCC risk and histology. The primary endpoint was overall
survival (OS) and secondary efficacy endpoints for this exploratory biomarker
analysis were radiographic progression-free survival (rPFS) defined by intentionto-
treat using the RECIST 1.1 criteria and radiographic response rates. Tissue
biomarkers (n=78) of mTOR pathway activation (phospho-S6 and -Akt, c-kit) and
VEGF pathway activation (HIF-1, c-MET) were prospectively explored in tumor
tissue by immunohistochemistry prior to treatment and associated with clinical
outcomes. We found that S6 activation was more common in poor-risk NC-RCC
tumors and S6/Akt activation was associated with worse PFS and OS outcomes
with both everolimus and sunitinib, while c-kit was commonly expressed in
chromophobe tumors and associated with improved outcomes with both agents.
C-MET was commonly expressed in papillary tumors and was associated with
lower rates of radiographic response but did not predict PFS for either agent. In
multivariable analysis, both pAkt and c-kit were statistically significant prognostic
biomarkers of OS. No predictive biomarkers of treatment response were identified
for clinical outcomes. Most biomarker subgroups had improved outcomes with
sunitinib as compared to everolimus.
Non-clear cell renal cell carcinoma (NC-RCC) comprises a genetically and histologically diverse set of cancers, including type 1 and 2 papillary renal cell carcinoma (RCC), chromophobe RCC, translocation carcinoma, as well as many other rare subtypes, some of which remain histologically unclassified1,2. NC-RCC accounts for about 25% of all cases of RCC. However, in the metastatic setting, the subtypes of NC-RCC that are most commonly found are type 2 papillary and unclassified NC-RCC given their more aggressive disease course1. We and others have recently reported on randomized prospective clinical trials comparing the vascular endothelial growth factor (VEGF) sunitinib with the mTOR inhibitor everolimus in patients with metastatic NC-RCC (ASPEN and ESPN)3,4. In these trials, sunitinib provided superior response rates and more durable control of disease; however, outcomes were heterogeneous based on histologic subtypes. For example, patients with papillary RCC and unclassified RCC, as well as those patients with good/intermediate risk disease had superior outcomes with sunitinib, while patients with chromophobe RCC and those with poor risk disease had superior outcomes with everolimus3. We recently reported differential outcomes based on differential plasma angiokine and immunokine levels in this setting, which were quite heterogeneously expressed according to disease risk and histology and over time during treatment resistance5.
These data support the concept that these non-clear cell tumors should be regarded as distinct molecular and phenotypic entities with distinct treatment outcomes with molecularly targeted therapies, and has been supported by retrospective studies suggesting a subset of patients with mTOR inhibitor sensitivity6
The identification of biomarkers predictive of treatment benefit is a major unmet need in the field of RCC therapy. In clear cell RCC, differential outcomes with immune checkpoint blockade have been observed in patients with tumors with sarcomatoid differentiation, those harboring particular immune subsets of T cell effector function, and perhaps certain complex genomic signatures7,8; however, these have not been established in non-clear cell RCC and are not commonly utilized to inform treatment selection. While histology (clear cell disease) is predictive of the benefits of high dose IL-2, and serum LDH may be predictive of the benefits of mTOR inhibition in poor risk RCC, there are no other clear predictors of treatment response or survival to specific therapies. An analysis of the RECORD-3 trial comparing sunitinib and everolimus identified several composite prognostic circulating biomarkers for progression-free survival with everolimus, but were unable to predict overall survival and the analyses were largely restricted to clear cell RCC99. In addition, a subset of papillary RCC patients have disease that is driven by activation of the c-MET oncogene, and may benefit from c-MET inhibitors10. Furthermore, recent data from the PAPMET randomized phase 2 trial suggests that dual VEGF/c-MET targeting with cabozantinib may provide a greater probability of durable disease control as compared to sunitinib in patients with advanced papillary RCC11.
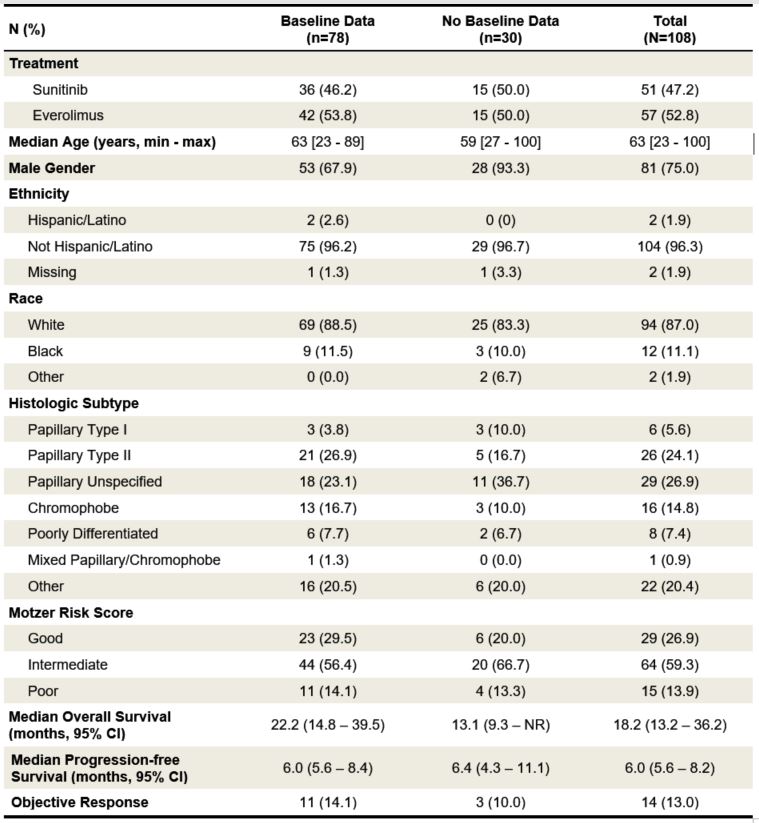
Table 1. Baseline characteristics of patients included in the present correlative IHC study
as compared to those patients without available biomarker data. NR indicates the estimate
was not reached.
Given the heterogeneity of genomic alterations and phenotype as well as clinical outcomes of patients with metastatic non-clear cell RCC, we sought to characterize markers of specific pathway activation linked to molecularly targeted therapies. To accomplish this, we utilized tissue based protein biomarkers of mTOR and VEGF/MET pathway activation in patients with metastatic non-clear cell RCC as part of the international, randomized, prospective clinical trial comparing sunitinib and everolimus (ASPEN). We asked whether evidence of mTOR pathway activity or VEGF-HIF-1α/MET expression differed by histologic subtype and MSKCC risk group12, 13, and whether clinical efficacy outcomes differed by baseline tissue pathway biomarker expression at the protein level. Based these previous studies, familial syndromes of mTOR pathway activation in chromophobe RCC14 and c-met pathway activation in hereditary and sporadic papillary RCC15, and our own plasma biomarker analysis5, our specific a priori hypotheses were that pS6 and pAKT high level expression will be associated with a greater radiographic progression free survival (rPFS) by RECIST 1.1 criteria with everolimus as compared to sunitinib as well as ORR and OS; c-KIT high level expression will be associated with chromophobe histology and a greater rPFS, ORR, and OS benefit with everolimus as compared to sunitinib; and finally that HIF-1 and c-MET will be associated with papillary RCC histology and will be associated with a greater rPFS, ORR, and OS benefit with sunitinib as compared to everolimus. We also suspected that high levels of pS6 and pAKT and cMET will be associated with poor outcomes overall including shorter rPFS, OS, and low ORR regardless of therapy.
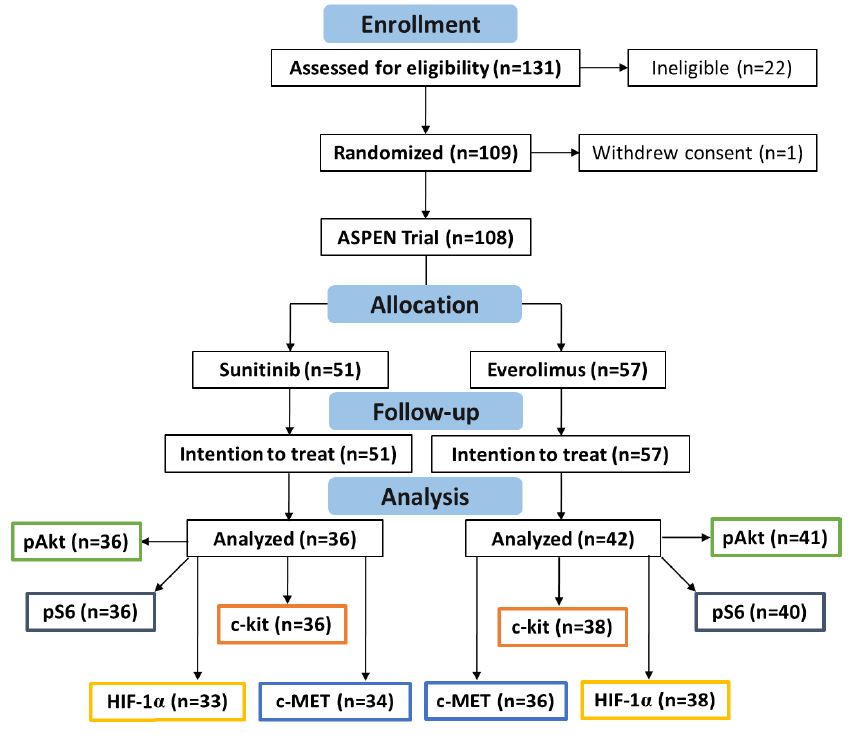
Supplementary Figure 1. CONSORT diagram for the ASPEN clinical trial and biomarker studies included.
We employed immunohistochemical studies of primary nephrectomy or metastatic biopsy specimens to examine the prognostic and predictive associations with progression-free and overall survival in this pre-specified prospective secondary analysis. Such findings could ideally permit the selection of patients for an mTOR or VEGF/MET treatment such as cabozantinib more optimally than histology or clinical risk score alone.
RESULTS
From September 23, 2010 through October 28, 2013, we accrued 109 subjects across three (3) countries and 17 participating sites.
One subject did not receive the study drug and withdrew and was replaced, leaving 108 evaluable subjects who were then randomized to sunitinib (51 subjects) or everolimus (57 subjects).
Biomarker data was available from 78 of 108 patients (72%), with over 90% of the cases derived from primary tumor tissue from nephrectomy or renal biopsy, including 36 patients treated with sunitinib and 38 patients treated with everolimus.
Thirty patients (15 in each treatment group) had insufficient tissue available for IHC studies, and are excluded from this analysis (see CONSORT diagram, Supplementary figure 1 ). The data lock for the final overall survival analysis was May 2016.
Patients in the biomarker evaluable population did not differ from those without evaluable biomarkers with the exception of more women (32% vs. 7%), more type 2 papillary (27% vs. 17%), and fewer intermediate MSKCC risk patients (56% vs. 67%) in the biomarker group, respectively (Table 1). The majority of evaluable patients (42/78, 54%) had metastatic papillary RCC with non-type 1 histology; only 3 patients had type 1 papillary RCC. The second most common histologic subtype was metastatic chromophobe RCC, which accounted for 17% of patients, followed by unclassified/poorly differentiated RCC, comprising 8% of patients.
Distribution of Tissue Protein Biomarkers
Lower protein expression scores were more common across all patients for p-Akt, HIF-1α, and c-kit with 1.3%, 12.8%, and 6.4% harboring at least 2+ expression by IHC. The distribution of IHC scores was fairly balanced for p-S6 and c-MET, with 44.8% and 43.6% of patients harboring
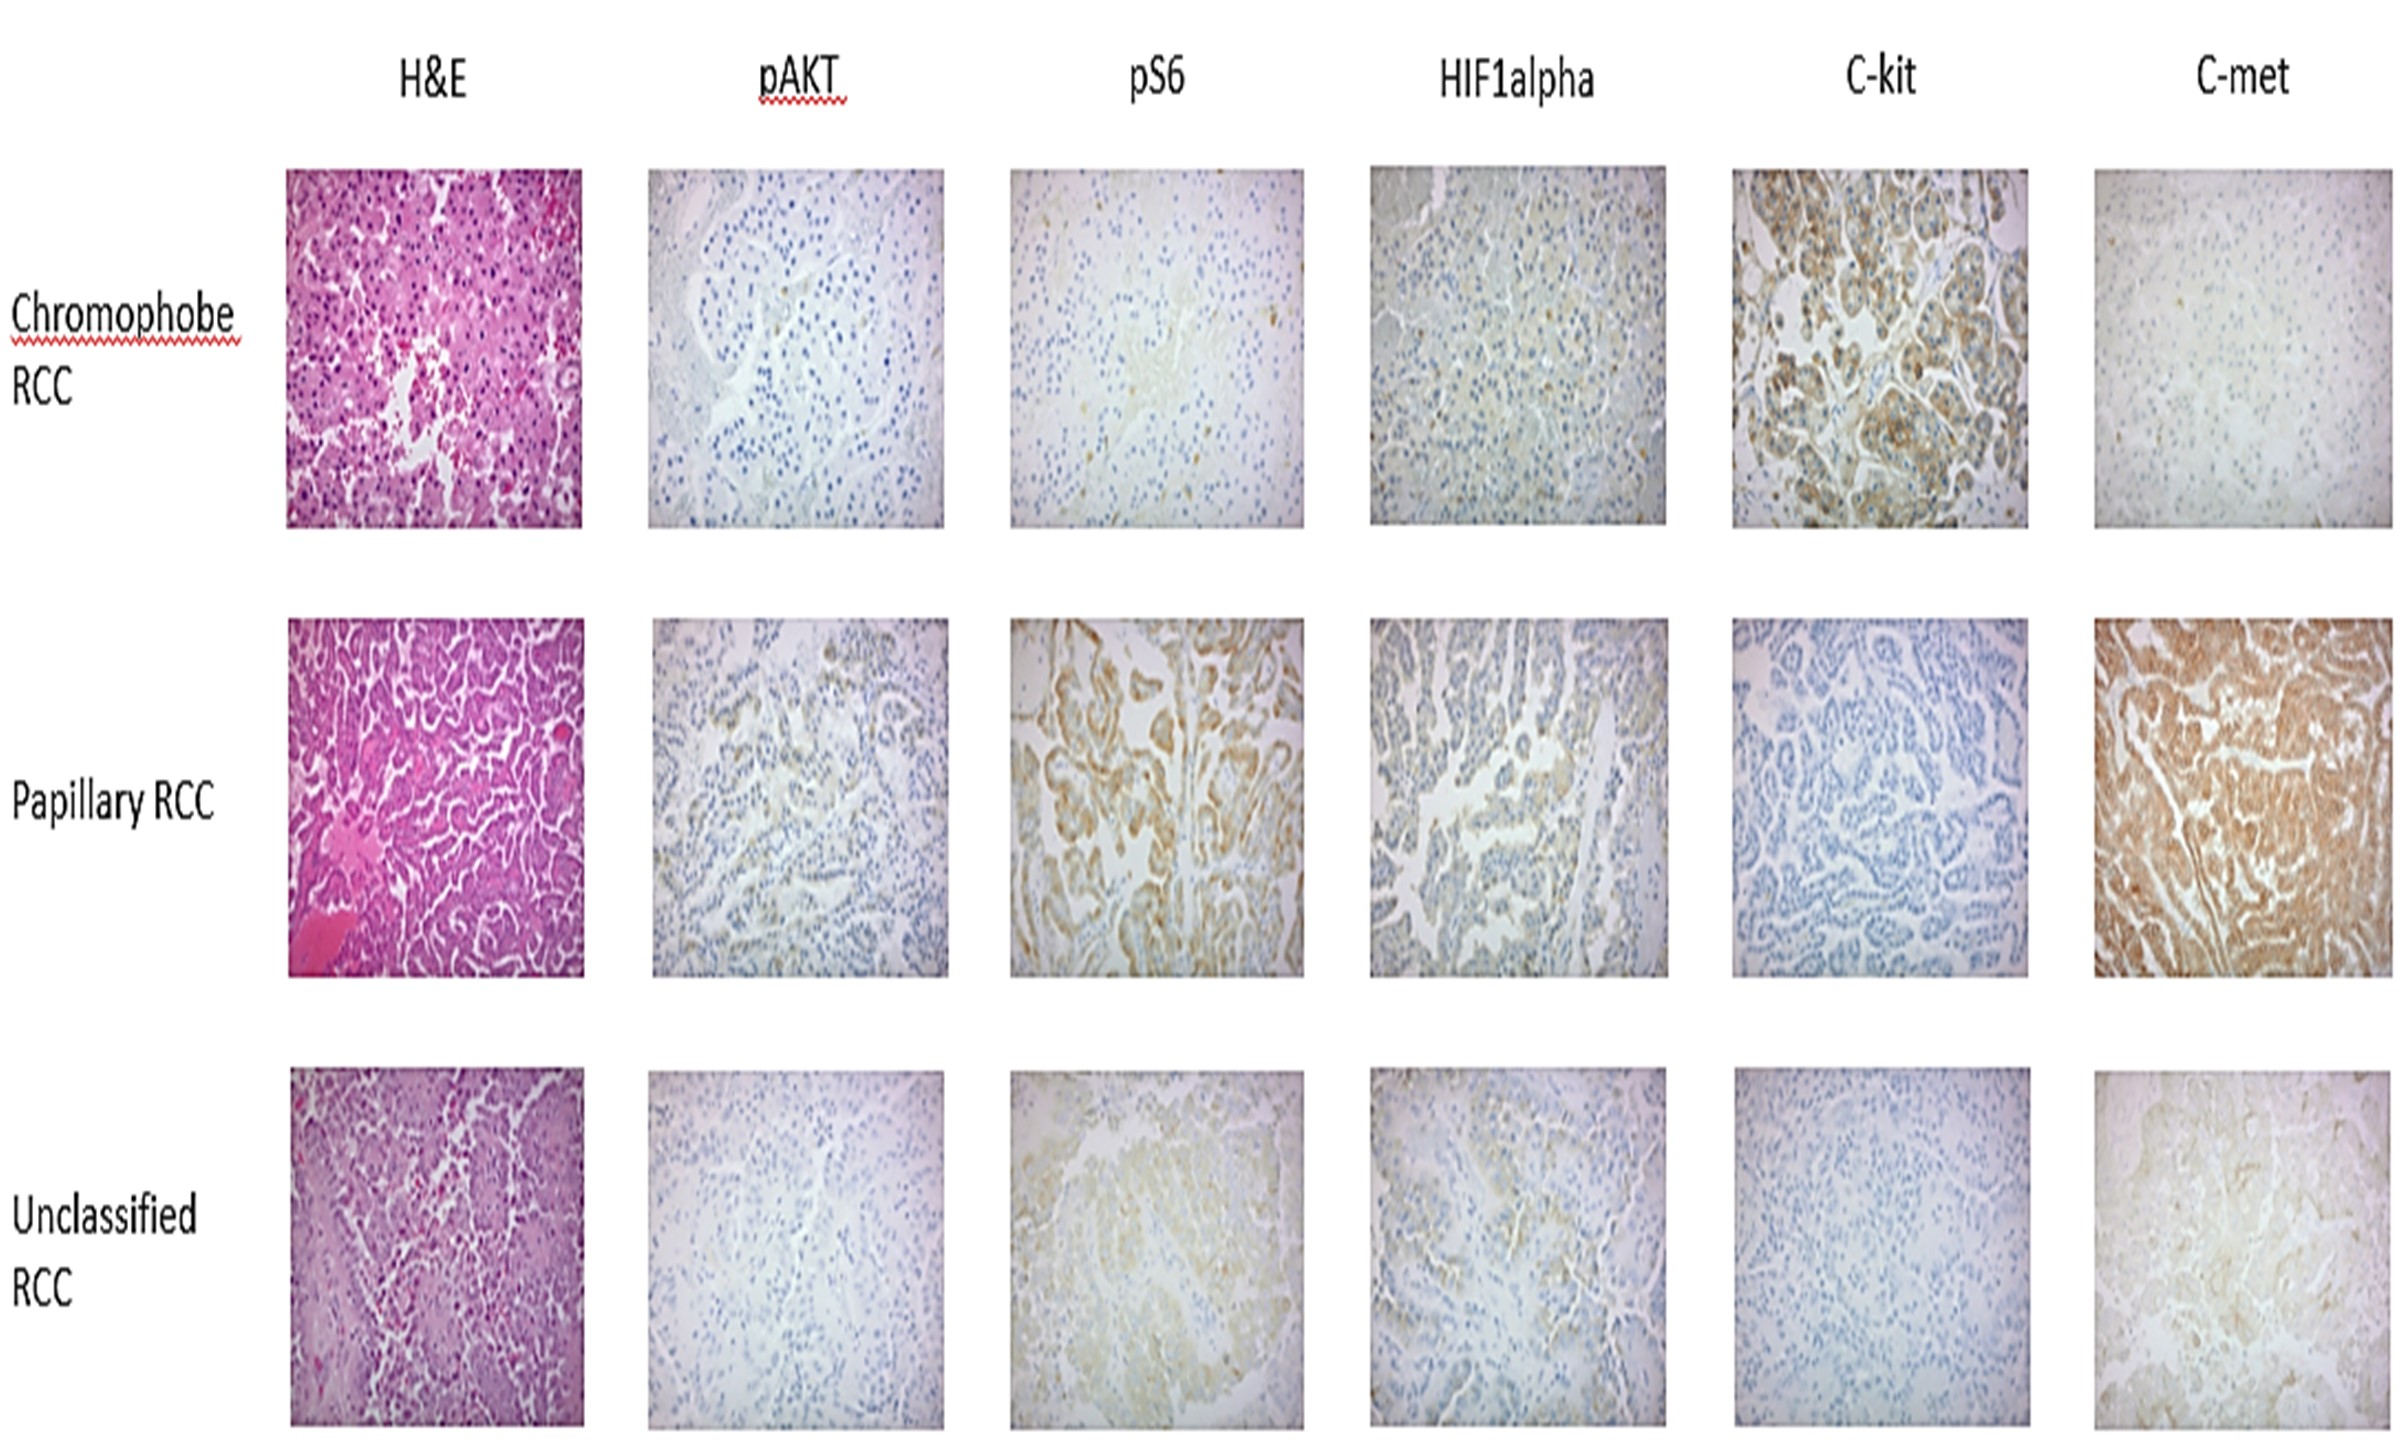
at least 2+ expression by IHC ( Supplementary Table 3 ). Representative IHC images of each biomarker across the 3 histologic subtypes are shown in Figure 1A.
Figure 1A. Representative images of biomarker expression by immunohistochemistry from the ASPEN study according to histologic subtypes of papillary, chromophobe, and unclassified RCC. Note c-kit expression predominantly in chromophobe RCC, c-met expression in papillary RCC.
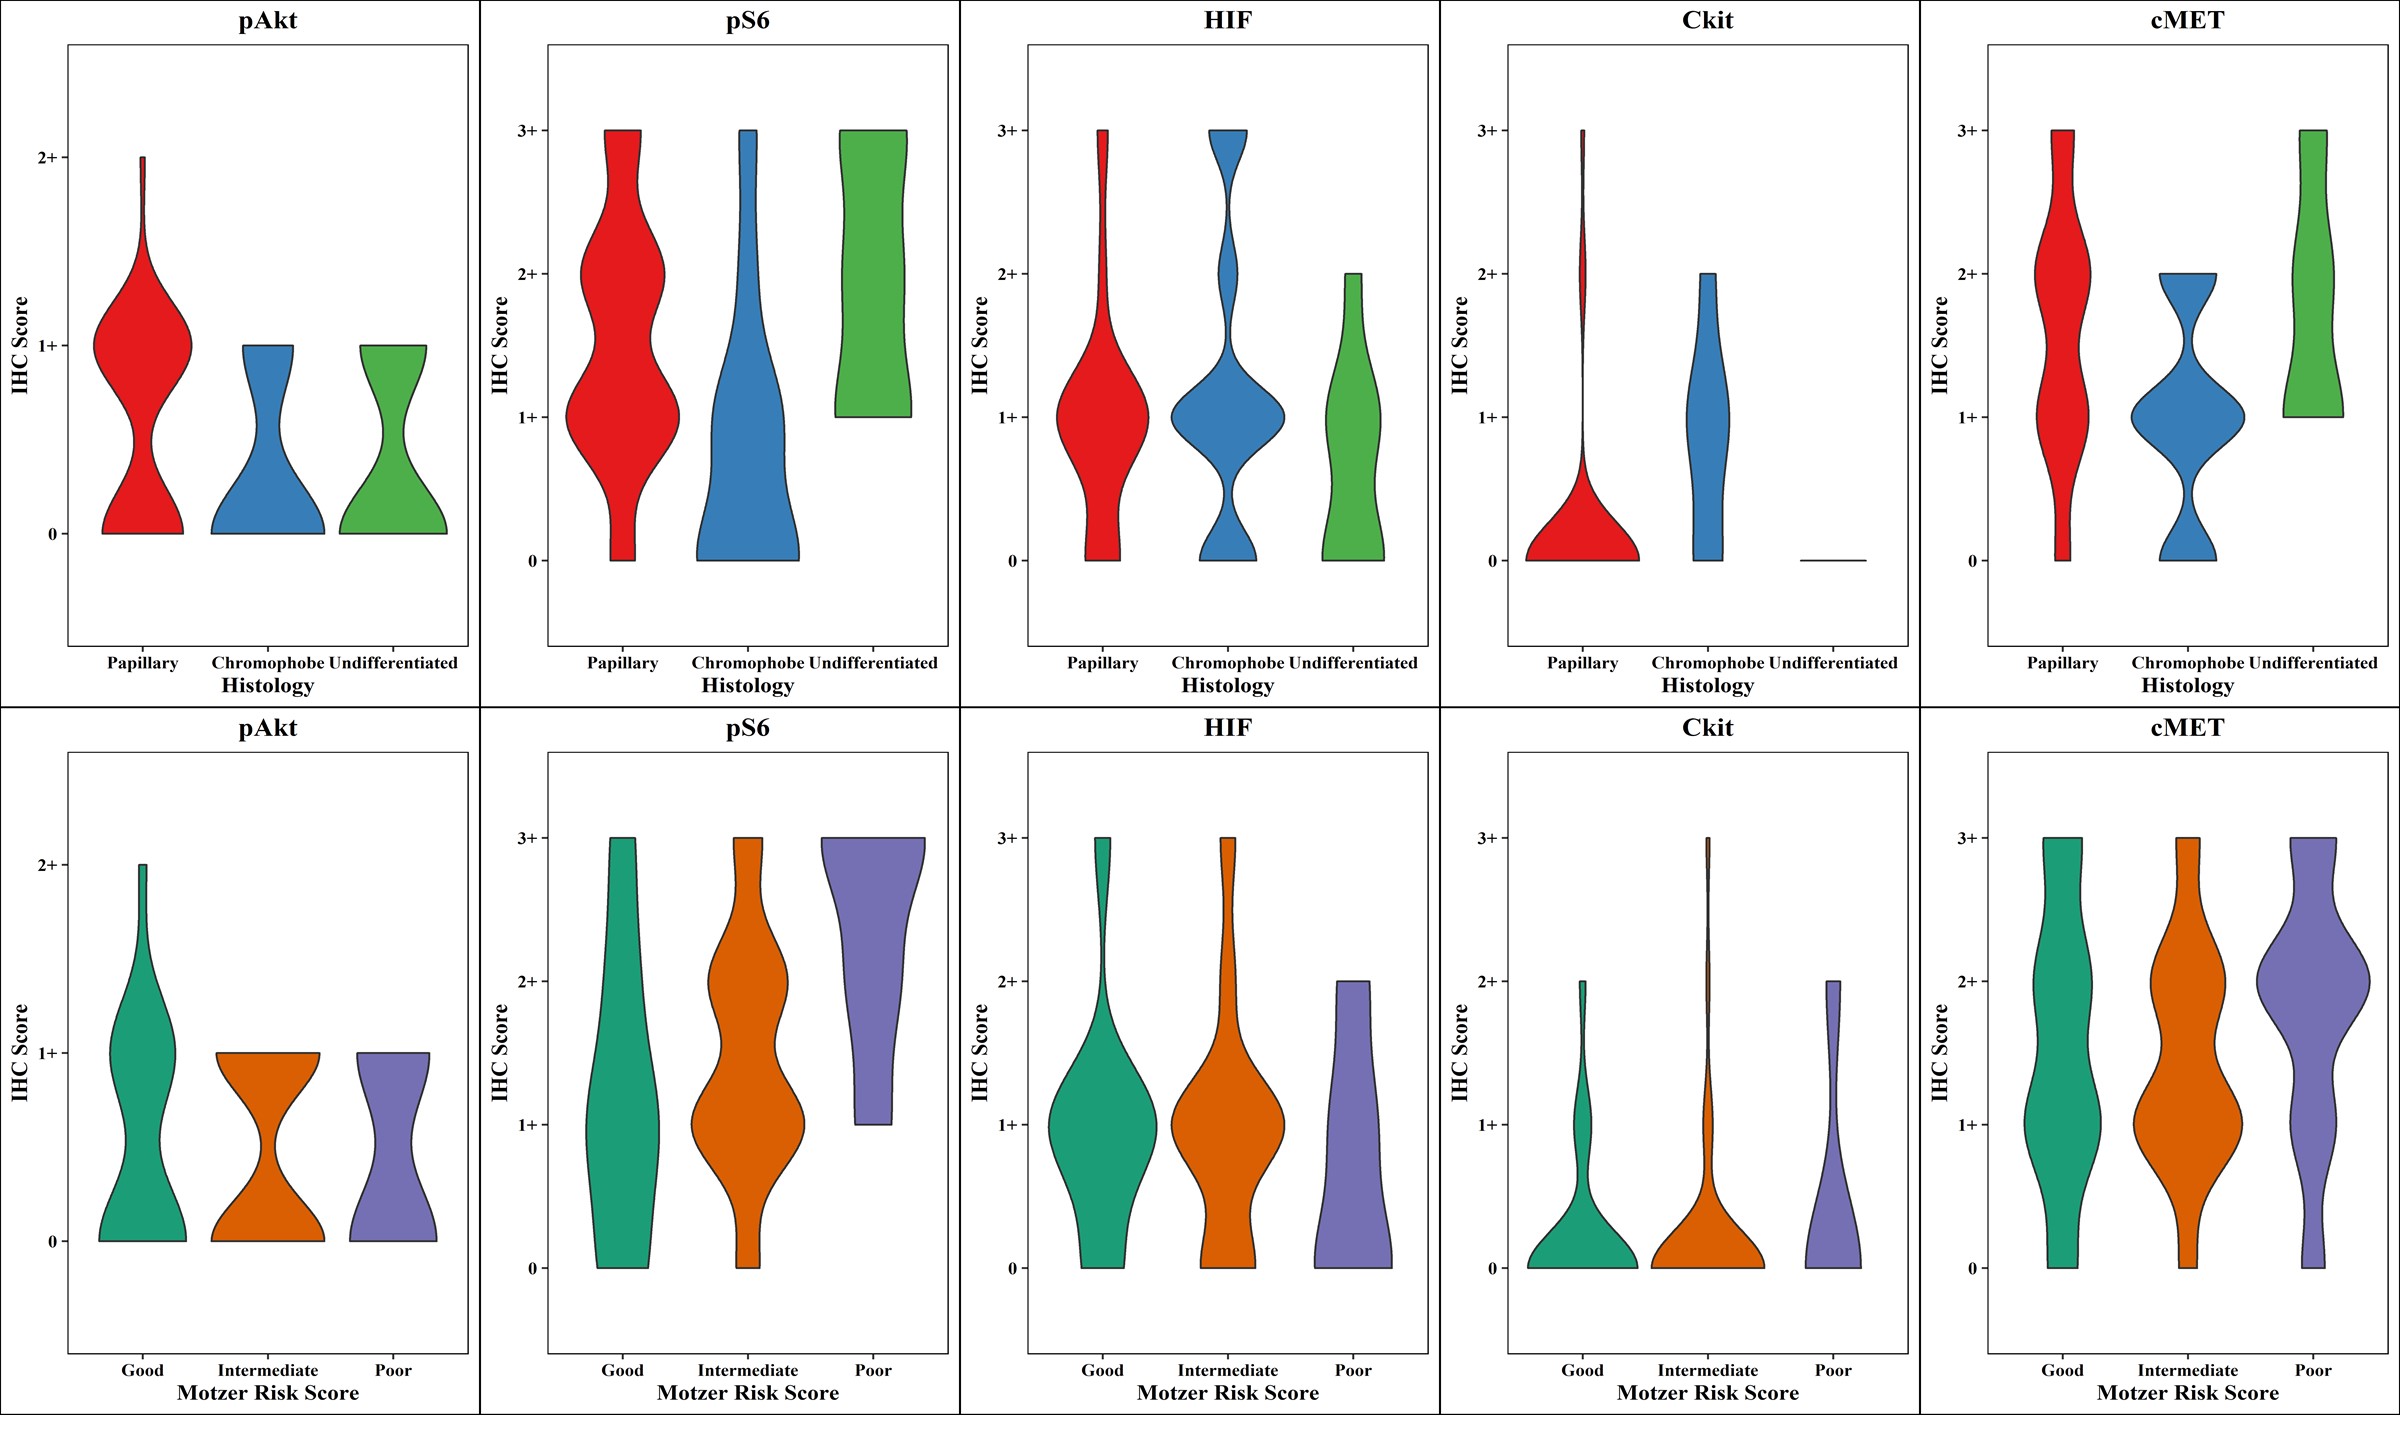
Figure 1B (Top). Distributions of tissue IHC biomarker expression levels according to histologic subtype categorized as papillary (red), chromophobe (blue), and undifferentiated (green).
Figure 1C (bottom). Distributions of tissue IHC biomarker expression levels according to MSKCC risk groups coded as good (green), intermediate (orange), and poor (purple).
Association of Tissue Protein Biomarkers with Histology and MSKCC Risk Group
Chromophobe patients had a greater percentage of 0 IHC values for p-Akt, p-S6, and c-MET, and as expected were more likely to have detectable (1+ or higher) c-kit expression than non-chromophobe RCC patients (62% vs. 5%)
(Figure 1B, Supplementary Table 3). The distributions were fairly uniform within each group for p-S6 and c-MET.
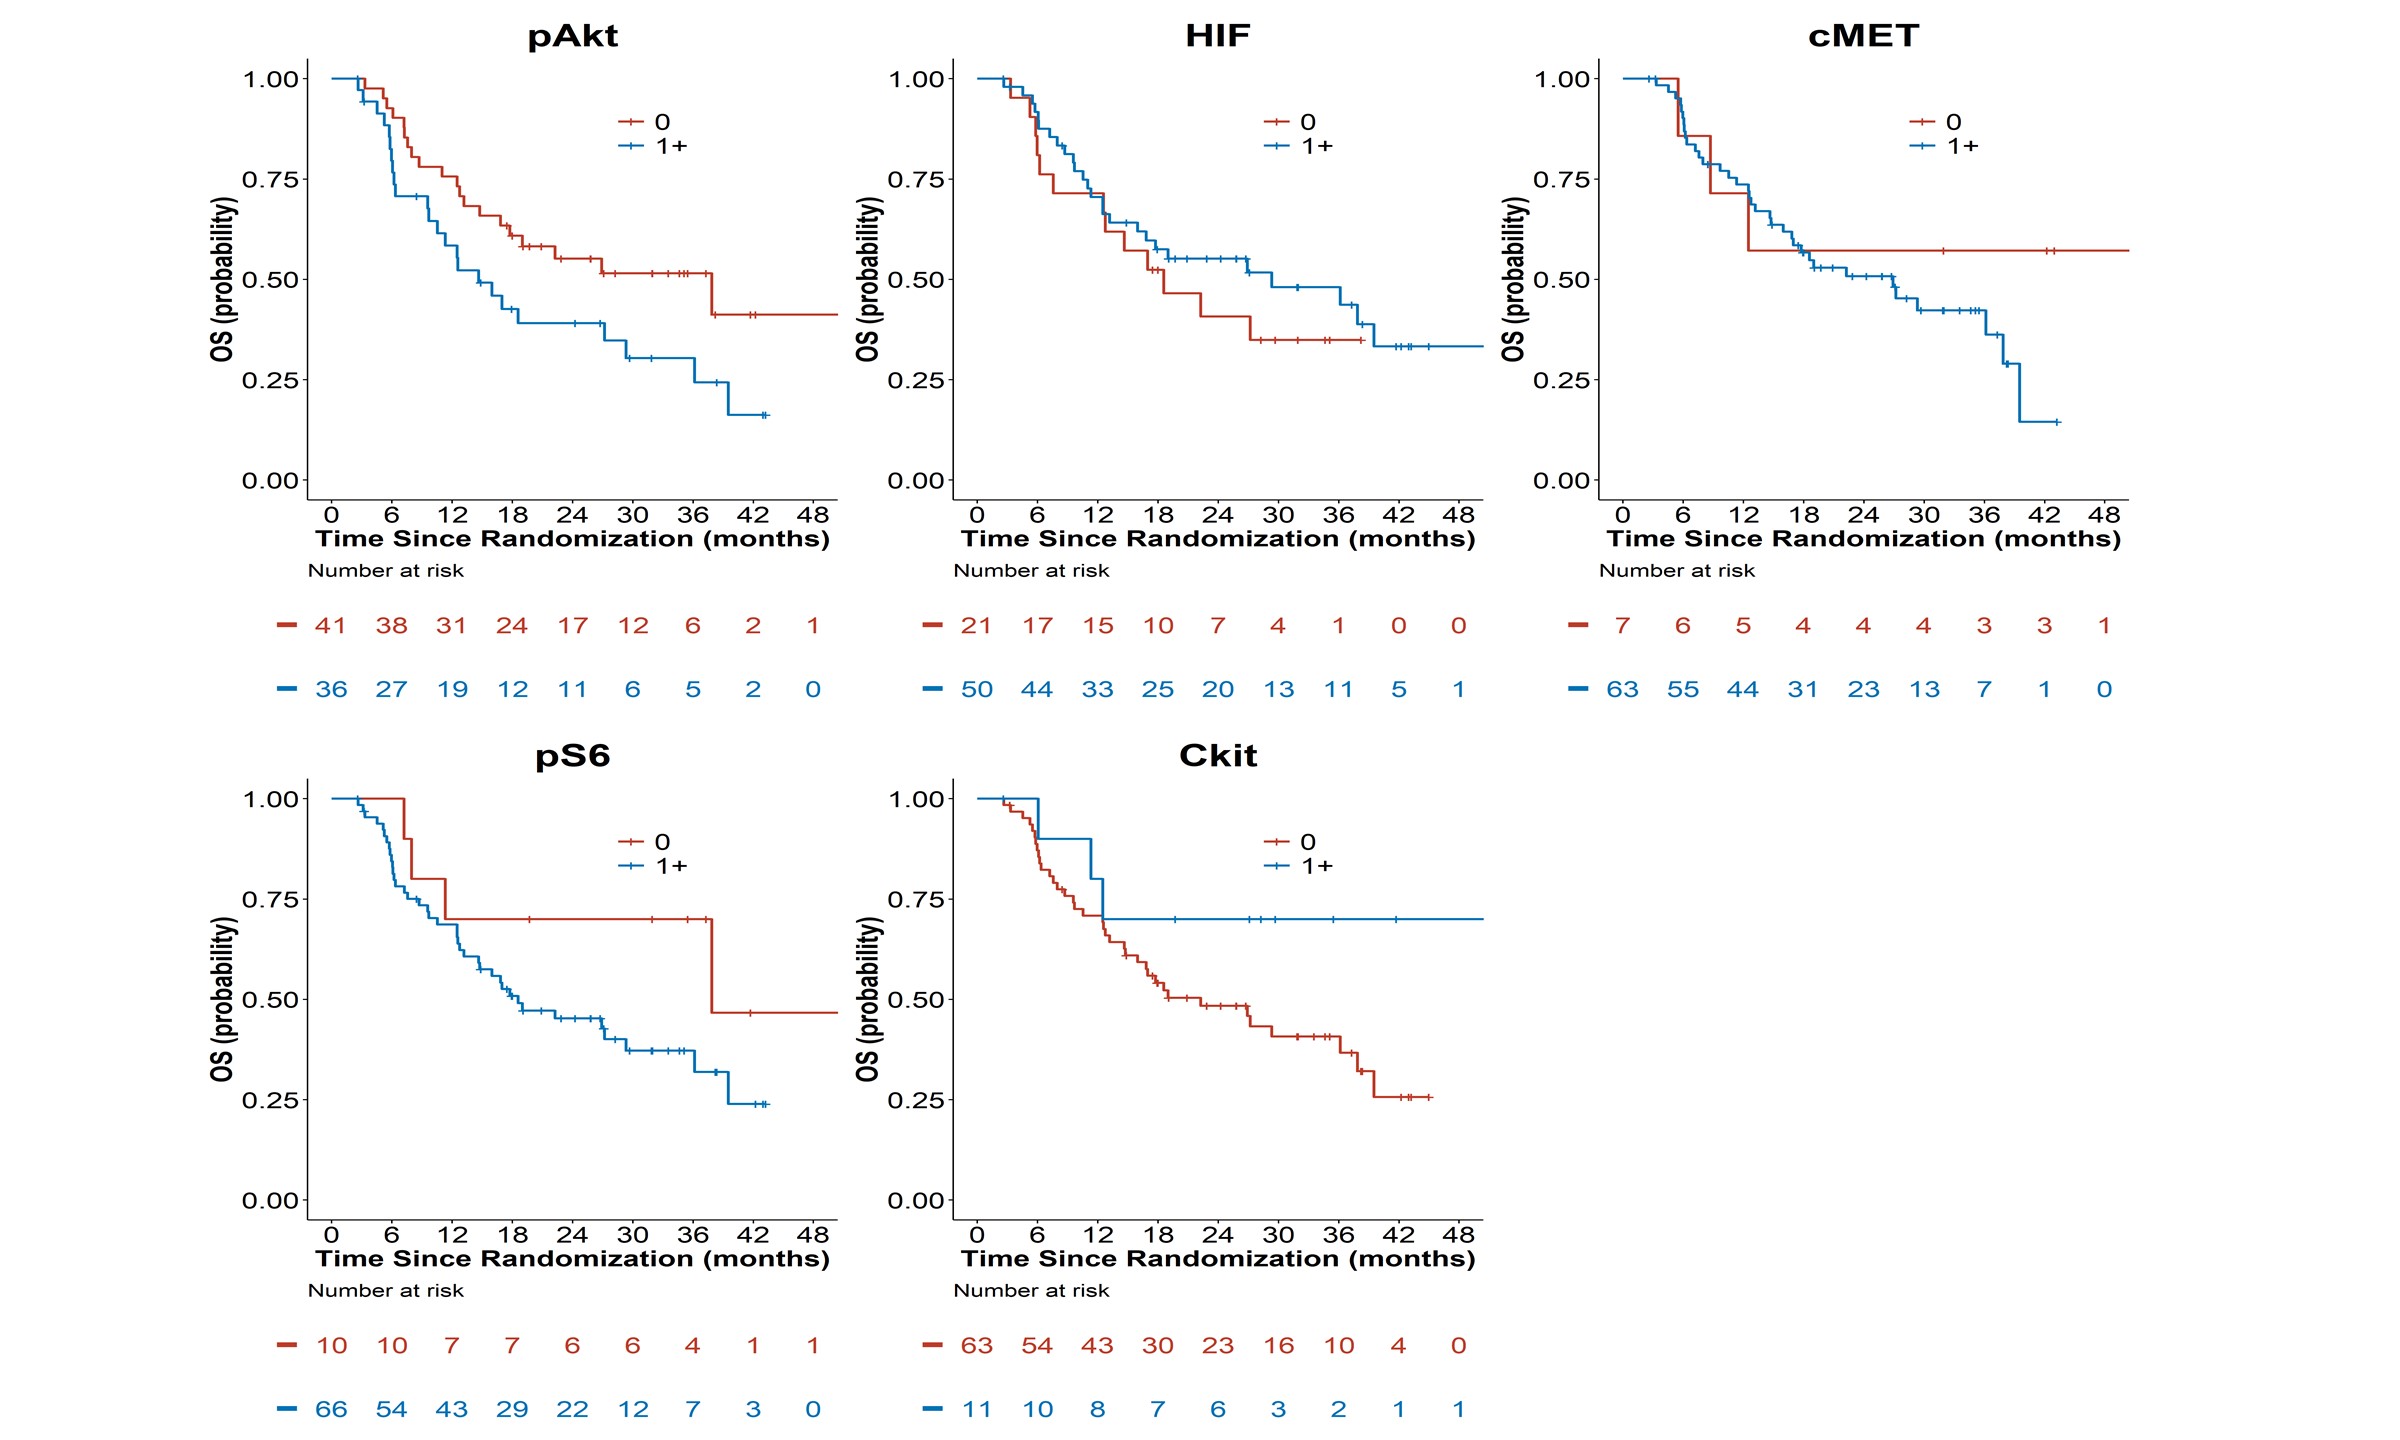
Figure 2A: Kaplan-Meier Overall Survival Curves by Tissue Biomakers (pAkt, pS6, HIF-1α, c-kit,
and c-MET). (B, Bottom).
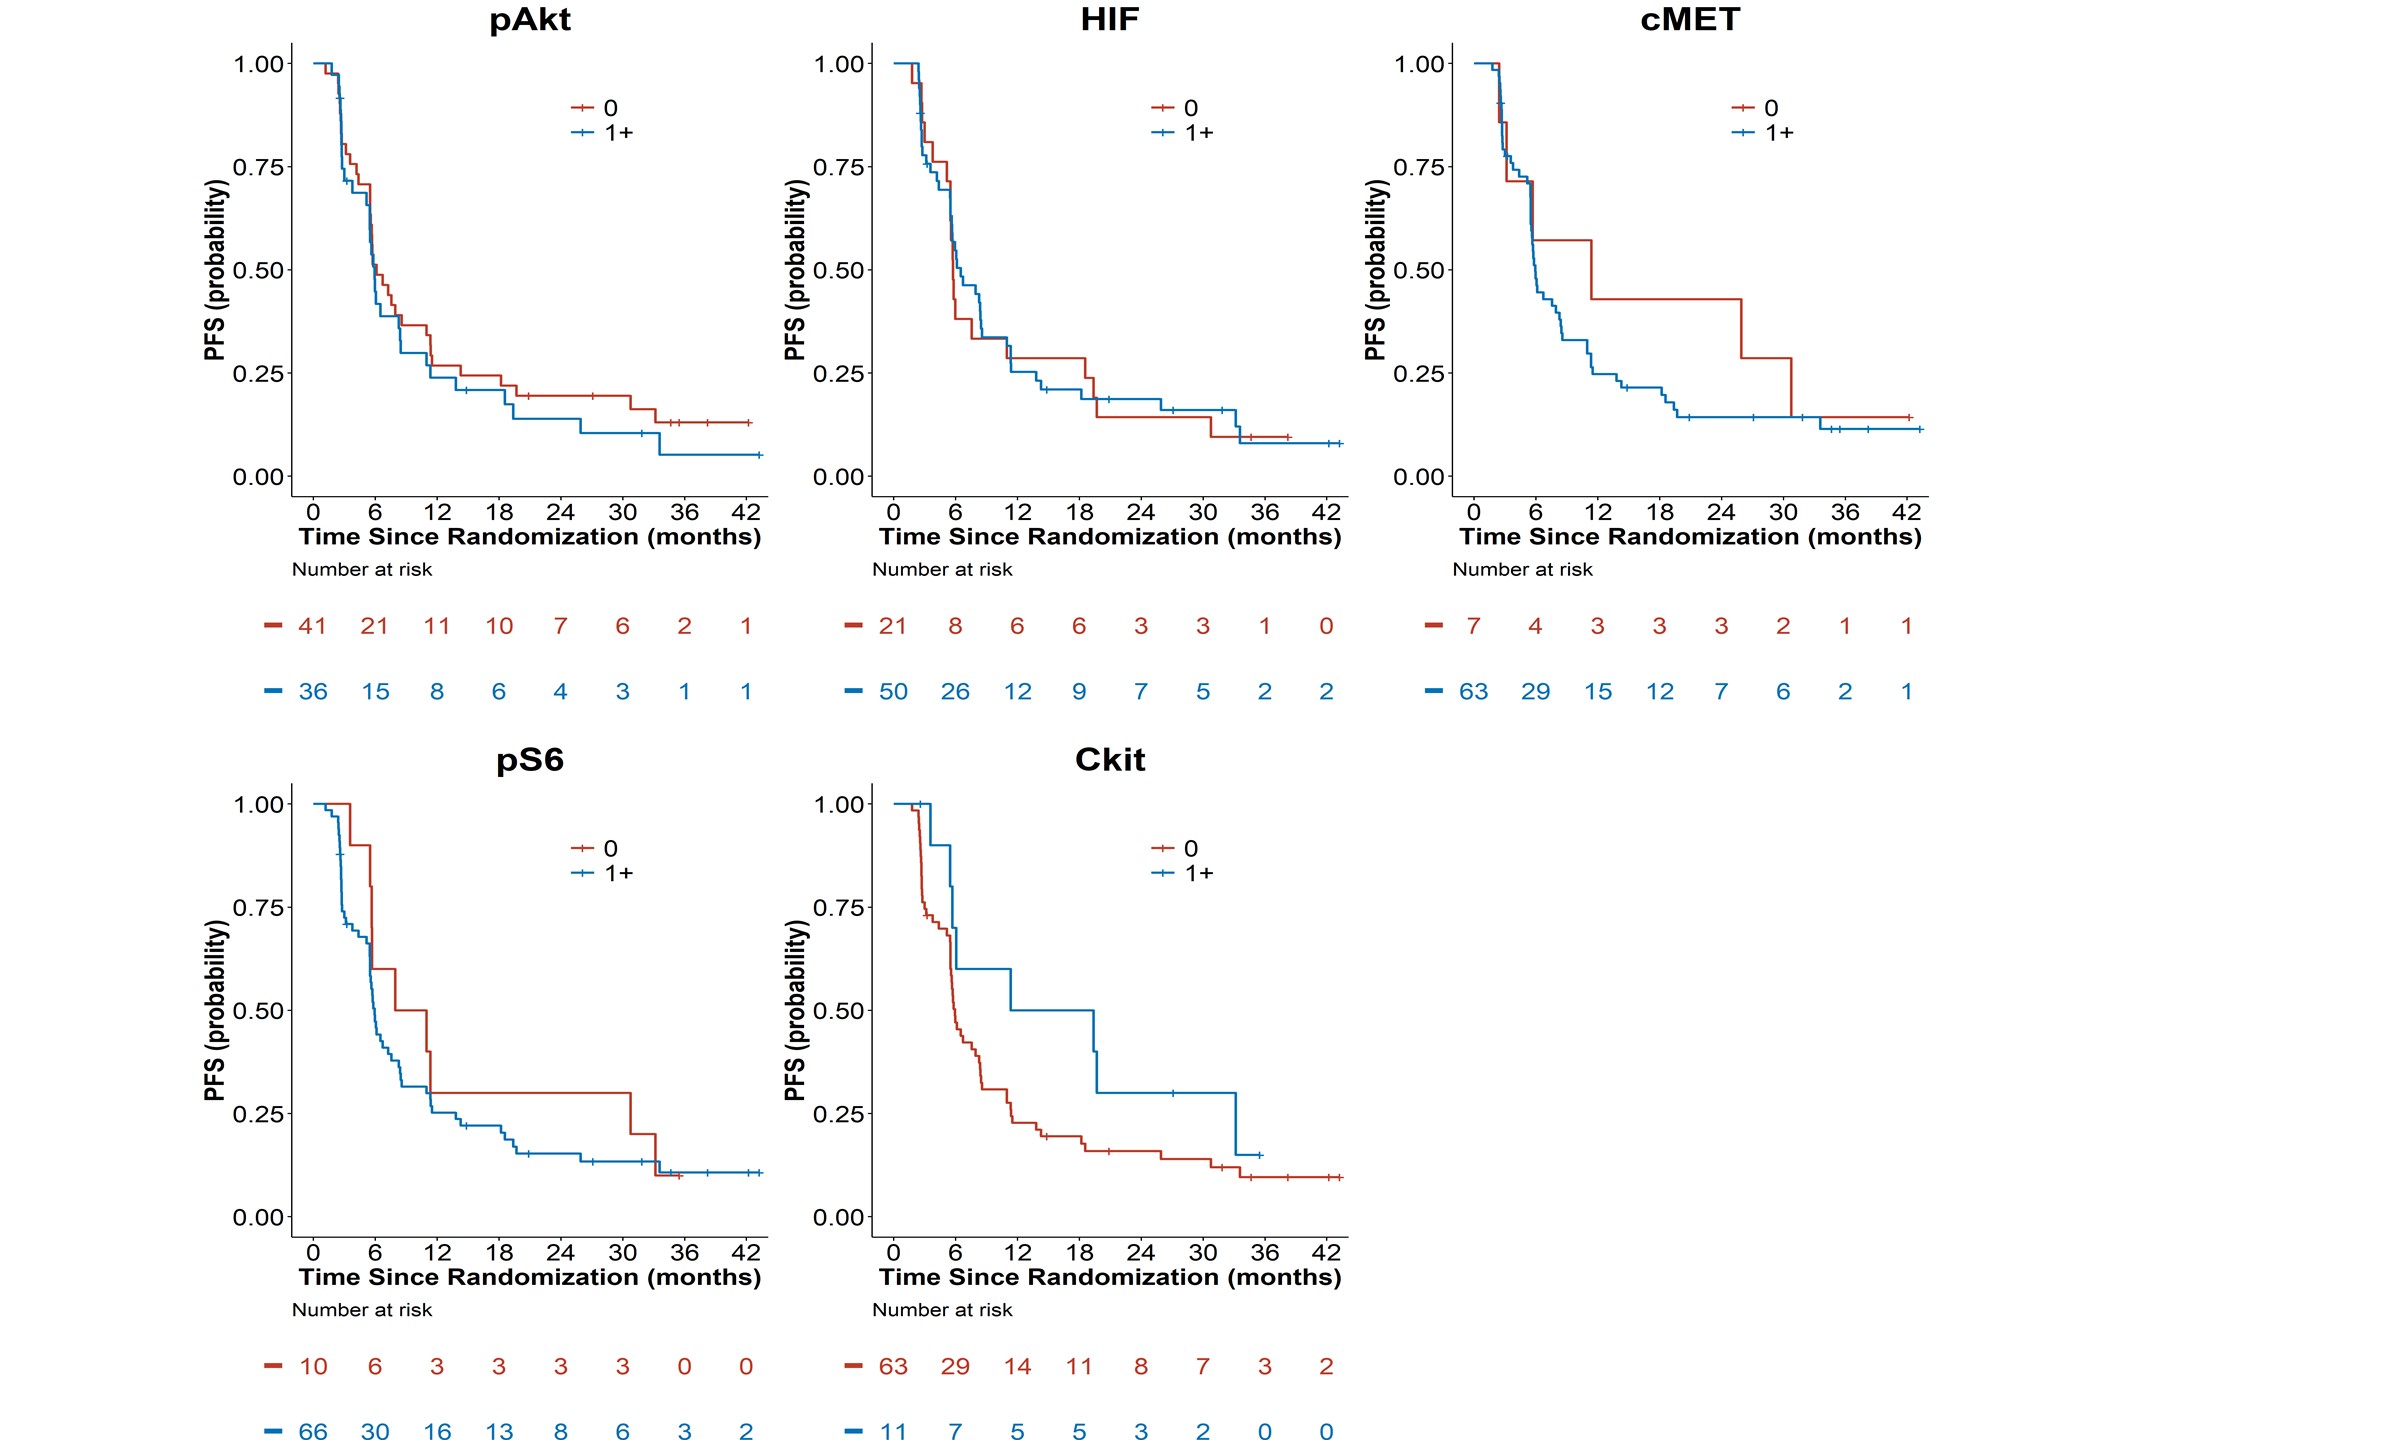
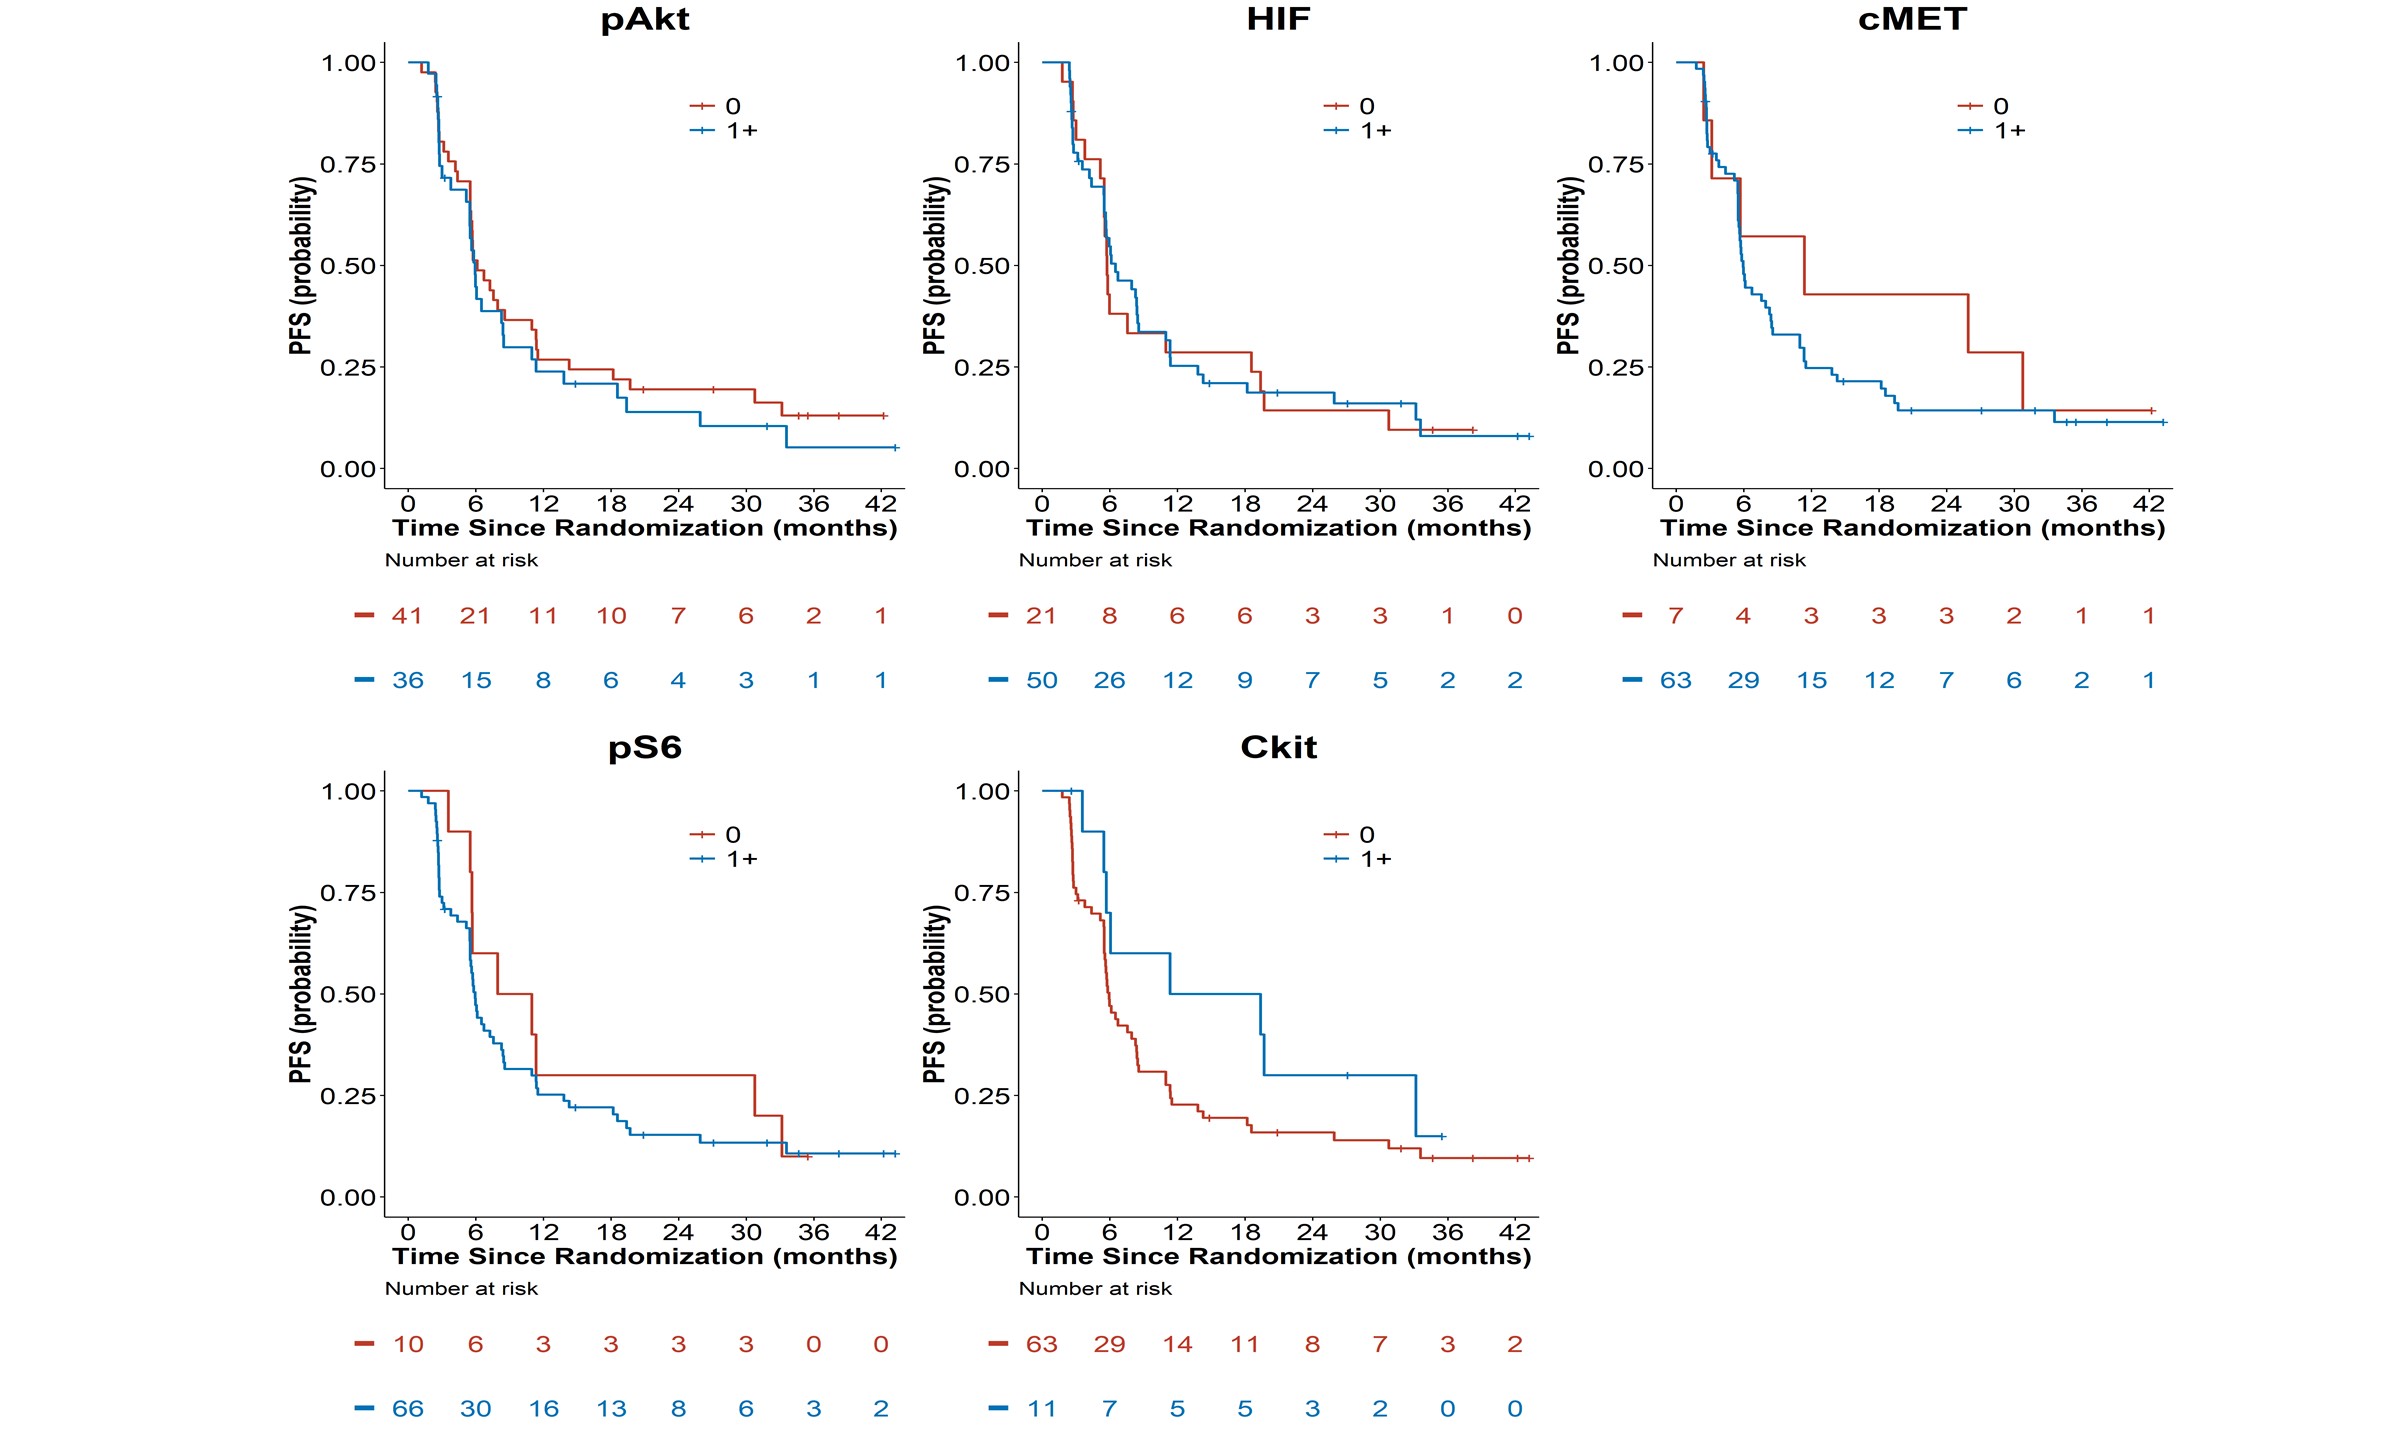
Figure 2B: Kaplan-Meier Progression-Free Survival Curves by Tissue Biomakers (pAkt, pS6,
HIF-1α, c-kit, and c-MET).
In papillary RCC, c-MET expression was absent in 9.3% of patients as compared to 23% of chromophobe and 0% of unclassified tumors. However, any expression and intense 3+ expression of c-MET was detected in 82%, 69%, and 86% in papillary, chromophobe, and unclassified tumors, respectively, while intense 3+ c-MET expression was detectable in 14%, 0%, and 18%, respectively, indicating the c-MET expression was not restricted to papillary subtypes.
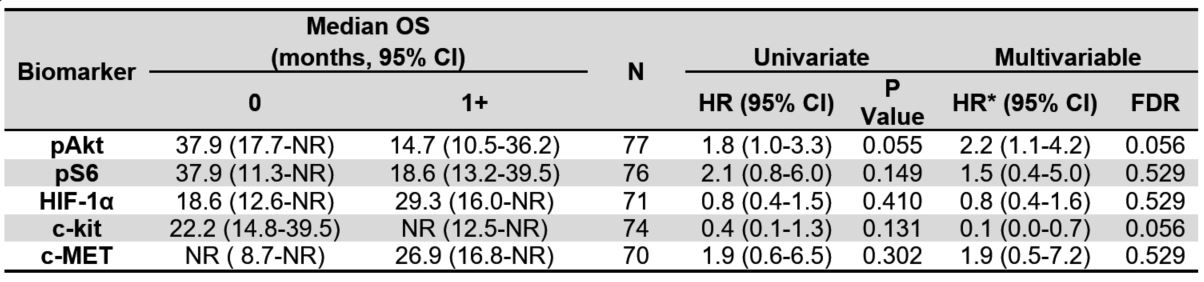
Table 2A. Median overall survival (OS) by tissue biomarkers for all evaluable patients. Univariate and
multivariable hazard ratios of OS for each biomarker. Cut-point of 1+ scoring. NR indicates the estimate
was not reached.
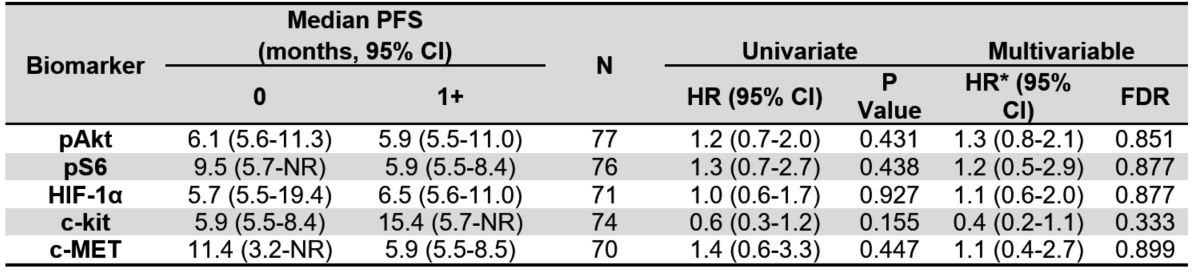
Table 2B. Median progression-free survival (PFS) by tissue biomarkers for all evaluable patients.
Univariate and multivariable hazard ratios of PFS for each biomarker. Cut-point of 1+ scoring. NR indicates the
estimate was not reached.
Phospho-Akt, HIF-1α, and c-MET scoring distributions were similar across the three MSKCC risk groups. Patients with good MSKCC risk were more likely to have absent p-S6 (26%) as compared to patients with poor MSKCC risk (0%), and less likely to have intense p-S6 staining of at least 3+ (13% vs 55%). Patients with good MSKCC risk had lower scores of p-S6 while relatively more poor risk patients had higher IHC scores for this biomarker
(Figure 1, Supplementary Table 3 ). Thus, neither c-MET nor p-AKT staining distinguished risk groups, while downstream p-S6 was clearly associated with poor risk disease.
Figure 3A. Kaplan-Meier Overall Survival Curves by Treatment Assignment and Tissue Biomakers
(pAkt, pS6, HIF-1α, c-kit, and c-MET).
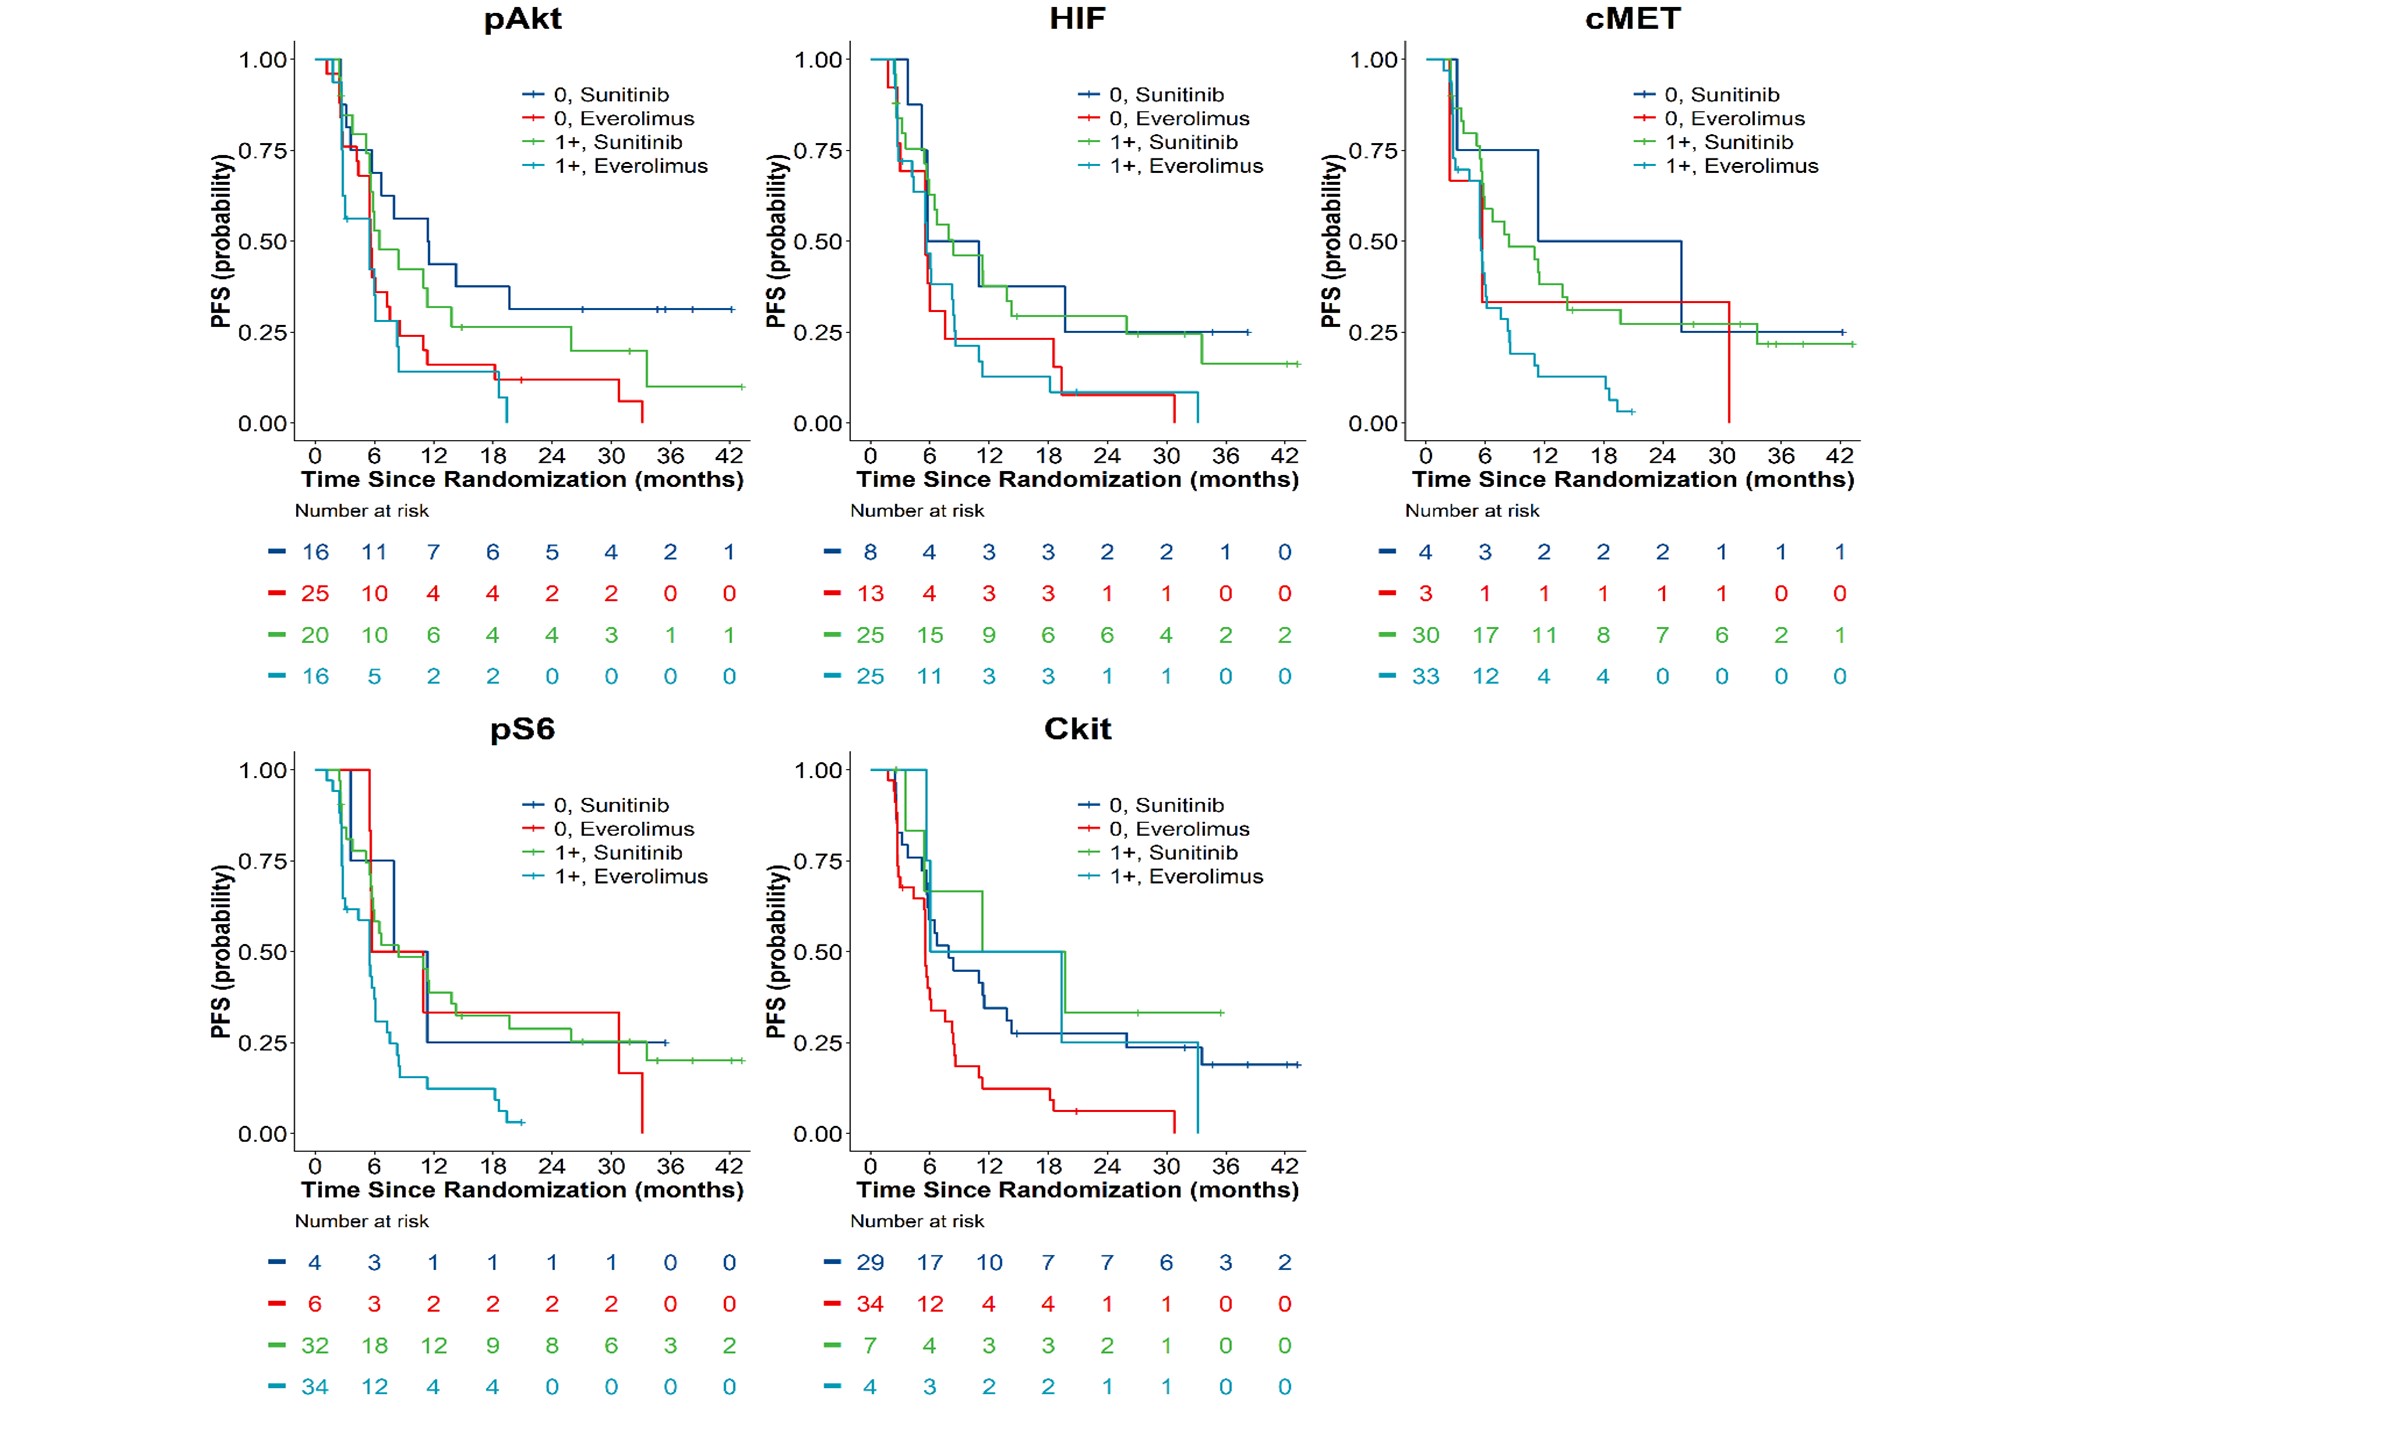
Figure 3B. Kaplan-Meier Progression-Free Survival Curves by
Treatment Assignment and Tissue Biomakers (pAkt, pS6, HIF-1α, c-kit, and c-MET).
Associations of Tissue Biomarkers with Clinical Outcomes
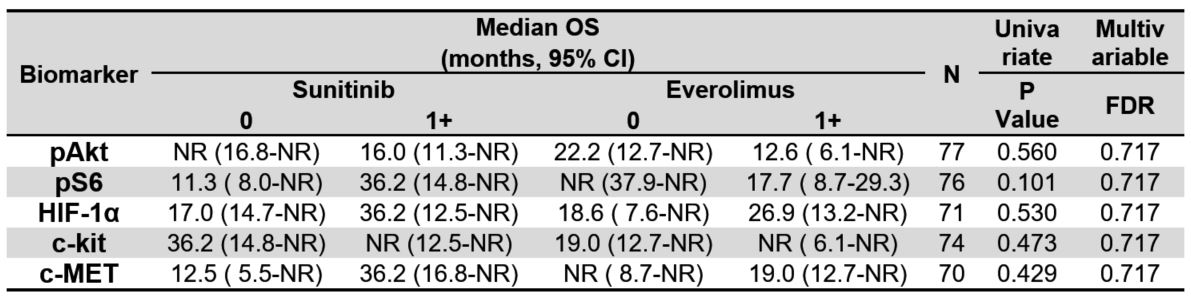
There were 67 PFS events and 44 deaths in 78 patients with evaluable tissue biomarker data and as of the final data lock in May 2016, the median follow-up time in 34 alive patients was 29 months (range=2.6-55.7). Patients with 1+ pAkt tumor tissue staining had a shorter median OS (14.7 months) as compared with patients with absent p-Akt (37.9 months). However, none of the five tissue biomarkers were prognostic of OS in univariate analysis (Figure 2A and Table 2).
In multivariable analysis of OS, however, both p-Akt and c-kit were statistically significant prognostic biomarkers of OS after multiplicity adjustment and adjustment for histologic type and MSKCC risk. The multivariable hazard ratio (HR) for death for p-Akt was 2.2 (95% CI=1.1-4.2, FDR=0.056). On the other hand, detection of c-kit was associated with improved survival (HR=0.1;95% CI=0.0-0.7; FDR=0.056) irrespective of histology.
Table 3A. Median overall survival (OS) by treatment group and tissue IHC biomarkers using
a cut-point of 1+, including biomarker-treatment interaction p-values. NR indicates the estimate
was not reached.
None of the tissue biomarkers were associated with PFS overall (Table 2B, Figure 2B). Additionally, when exploring a higher threshold cut-off for IHC positivity of 2-3+ expression, none of the biomarkers had statistically significant associations with OS or PFS in secondary analyses comparing biomarker expression 0-1 versus >2+
( Supplementary Table 5A and 5B ).
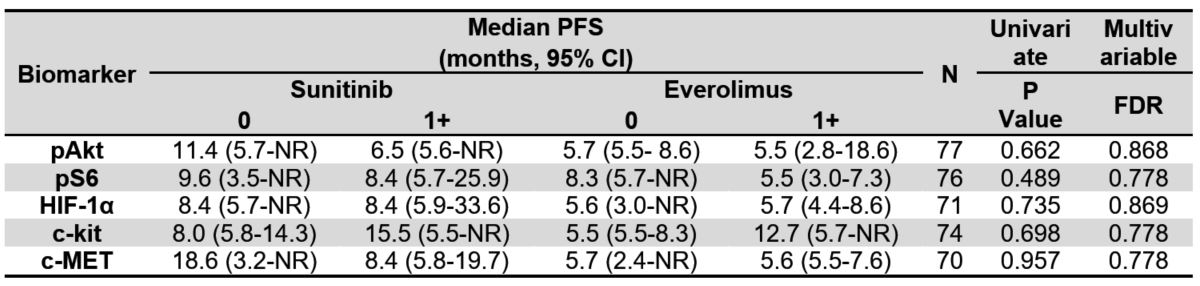
Table 3B. Median progression-free survival (PFS) by treatment group and tissue IHC
biomarkers using a cut-point of 1+, including biomarker-treatment interaction p-values. NR
indicates the estimate was not reached.
Predictive Associations with Clinical Outcomes
Finally, we examined each of the 5 pathway-based protein biomarkers for associations with outcomes of either sunitinib or everolimus and the predictive value of biomarker expression for superiority of one therapy over the other. None of the tissue biomarkers were predictive of treatment benefit for OS or PFS for suninitib or everolimus (Tables 3A and 3B) regardless of the IHC scoring thresholds
( Supplementary Table 5A and 5B ). Lastly, while none of the biomarkers were predictive of differential objective response
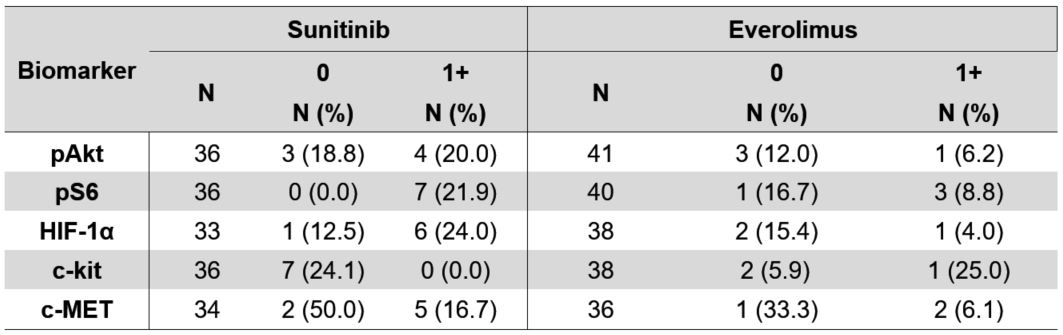
(Tables 4B and Supplementary Table 7B ), we did note that patients with c-MET expressing tumors had a lower objective response rate by RECIST 1.1 (11% ORR) as compared to patients with tumors lacking c-MET expression (43% ORR). In sunitinib treated patients, the ORR was 17% vs 50% in patients with c-MET expressing vs. non-expressing tumors, while in everolimus treated patients, the ORR was 6% vs. 33% respectively. The ORR for patients with high c-kit expression was 0% for sunitinib vs. 24% for patients with absent c-kit expression, as compared to the opposite result for everolimus, which had an ORR of 25% for patients with high c-kit expression as compared to 6% for patients that lacked c-kit expression.
Discussion
The treatment of patients with metastatic non-clear cell RCC continues to evolve and improve. Based on the ASPEN and ESPN randomized trials, sunitinib was demonstrated to have more prolonged progression free and overall survival and higher objective response rates as compared to everolimus3,4 overall and particularly in favorable/intermediate risk and papillary/unclassified subtypes. However, everolimus had clear activity and and improved outcomes in patients with poor risk disease and chromophobe RCC variants, mirroring prior prospective data derived from the global phase 3 temsirolimus trial. Recently cabozanitinb was shown to have superior responses and PFS as compared to sunitinib in advanced papillary RCC (both type 1 and 2), suggesting that dual inhibition of c-MET and VEGF may provide more durable clinical benefits11. Here we sought to identify subgroups of patients that may differentially respond to molecularly targeted therapies through the use of protein-based assays of potential driver pathways. While we found that activation of the mTOR pathway including low level Akt and S6 phosphorylation was associated with poor risk disease and worse survival, these biomarkers were not sufficiently predictive of clinical benefit for everolimus compared to sunitinib. While chromophobe patients with high c-kit expression had a numerically higher ORR with everolimus than sunitinib, this did not translate into longer PFS or OS potentially due to the relatively small sample size of this subgroup.
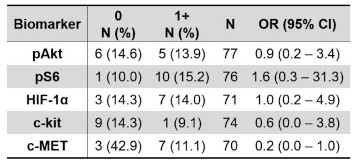
Table 4A. Objective response rate showing N (%) and odds ratio (95% CI) by IHC 0 vs. 1+ biomarker status.
Recently, we identified specific subsets of non-clear cell RCC patients that have poor outcomes in the ASPEN trial based on levels of plasma angiokines associated with angiogenesis, metastasis, and immune evasion, particularly osteopontin (OPN), TIMP-1, thrombospondin-2, hepatocyte growth factor (HGF), and VCAM-116. These data suggest potential therapeutic targets associated with disease burden and treatment resistance. We could not directly assess most of these biologic features in tumor tissues, and thus cannot correlate tumor angiokine expression with plasma levels and clinical outcomes.However, when we could there was not a clear correlation with outcomes. For instance, we evaluated c-met, the receptor for hepatocyte growth factor, in tumors and found no correlation with c-met levels and clinical outcomes in non-clear cell as well as the subset of papillary RCC patients treated with sunitinib or everolimus, despite a prognostic association of high plasma HGF levels with poor overall survival5. Other assessments of pathway addiction such as c-met phosphorylation or amplification or splice variants, or mTOR pathway mutations17,18 should be further evaluated against specific targeted therapy outcomes in this context.
Table 4B. Objective response rate by treatment assignment and IHC 0 vs. 1+ biomarker status.
Our analysis has several limitations. The first is the heterogeneous nature of our patient population, comprised of multiple tumor types with likely widely differing genotypes and biomarker expression profiles and differing clinical risk groups. This limits our power to determine predictive interactions for individual subgroups and therapies. The second is the current lack of genotyping data in this trial at the present time, which does not permit a more detailed molecular analysis of pathway mutations, amplifications, splice variants, or expression. We chose to focus our biomarker studies for the present analysis on protein and phosphoproteomic alterations given that the functional consequences of the known genomic alterations is frequently unknown, and we hypothesized that these pathway-based protein assays would be more functionally relevant to drug activity for therapies targeting the mTOR or VEGF pathways. Third is the lack of present information in this trial on the activity of other pathways, such as the NRF2/KEAP1, fumarate hydratase and other metabolic regulators, or epigenetic regulators. Further investigation into these and other key biologic processes including the immune landscape of these tumors may shed light into future therapeutic directions, including combination VEGF/c-MET and immune checkpoint blockade or novel approaches.
Our work has several strengths, including being the largest, prospective global trial conducted to date in this metatatic non-clear cell RCC population. We mandated tissue collection as part of eligibility, which ensured a robust program for biomarker study, and we utilized previously validated IHC assays with appropriate validated controls. Our pathologists were blinded to outcome, while our statisticians performed the clinical analysis while blinded to biomarker studies, ensuring a lack of bias in the data analysis plan. While the trial was open label for treatment, treatment was randomized and not selected based on any patient or tumor characteristics. IHC studies are relatively easy to conduct in clinical practice relative to complex genotyping assays, and thus this work could be readily applicable if successful. Finally, we conducted long term follow up to ensure an adequate number of events for the gold standard of overall survival as an endpoint.
In conclusion, we demonstrate the negative prognostic value for Akt pathway activation in non-clear cell RCC and the positive prognostic value for c-kit expression in a prospective clinical trial of sunitinib vs. everolimus. Additionally, we show that c-MET expression is associated with a poor response to sunitinib or everolimus, while c-kit expression is associated with a better response to everolimus. However, we were unable to show a predictive treatment-biomarker interaction using the 5 pathway-directed biomarkers in this study, and thus, overall sunitinib remained the superior therapy in the ASPEN trial.
MATERIALS AND METHODS
Study design and patients
This was a prospective, open-label randomized United States Food and Drug Administration IND-exempt trial conducted across 17 participating global sites, including the United States, Canada, and the United Kingdom. Regulatory oversight in Canada and the UK was obtained for this trial. After meeting eligibility, randomized subjects were assigned 1:1 to either sunitinib malate or everolimus at approved doses until disease progression.
Patients were eligible if they had histologically confirmed advanced RCC with non-clear cell pathology after local site review by pathology, including unclassified subtypes. Mixtures of these non-clear cell variants were allowed provided they consisted predominantly (> 50%) of papillary, chromophobe or undifferentiated histology. Patients with minor clear cell components (<50%) were permitted provided the dominant histology and presumed primary histology was non-clear cell. Exclusion criteria for the study included active untreated CNS metastases, prior systemic therapy for RCC, and collecting duct or medullary histology. Full eligibility details are provided in the primary clinical manuscript3.
This study was registered as an International Standard Randomised Controlled Trial with ClinicalTrials.gov number NCT01108445. All patients provided informed consent under an institutional IRB-approved consent form. This was an investigator-initiated study, with the Duke Cancer Institute as lead coordinating center and biorepository. A contract research organization, inVentiv Health Clinical, oversaw the collection of data and safety monitoring on behalf of Duke globally.
Tissue Biomarker Studies
Primary nephrectomy or metastatic biopsy specimens were prospectively collected on all patients as part of the eligibility criteria for the ASPEN trial. Formalin-fixed paraffin embedded tissue was collected and underwent IHC studies for 5 biomarkers: phospho-S6 and phospho-Akt as measures of mTOR pathway activation; c-kit as a defining biomarker of chromophobe RCC which has been associated with mTOR pathway activation through folliculin mutations 14; c-MET total expression; and HIF-1α as a measure of VEGF pathway activation. The specific antibodies utilized and validated on control tissues, their concentration/dilution, and methods used are described in
( Supplementary Table 1 ). Investigators and statisticians were blinded to the results of these biomarker studies at the time of outcome analysis.
Outcomes
The primary endpoint of this tissue biomarker study was overall survival (OS), defined as the interval from date of random assignment until date of death or date of last follow-up. A key secondary outcome included radiographic progression-free survival (PFS), defined as the time from date of random assignment until date of disease progression (by RECIST 1.1 criteria), a new primary malignancy, or death, whichever occurred first. Other pre-specified efficacy secondary endpoints included radiographic response rates per RECIST 1.1, and clinical benefit response (CBR), defined as the composite sum of partial response, complete response, and prolonged stable disease for more than 6 months. Objective response rate (ORR) was defined as the sum of complete and partial response by RECIST 1.1.
Statistical analysis
The five tissue biomarkers (phospho-S6, phospho-Akt, c-kit, HIF-1α, and c-MET) include the IHC scores of 0, 1+, 2+, or 3+. Missing data from the 78 evaluable patients were excluded from the analyses and resulted from either an insufficient amount of tumor to categorize the sample, the sample being of an unacceptable quality, or a lack of tissue provided by the patient. All five tissue biomarkers were diochotomized and analyzed using two pre-specified cut-points in the statistical analysis plan. The primary analysis was based on 0 vs. 1+ whereas the secondary analysis was 0-1 vs. 2+, where the “1+” group included scores of 1+, 2+, and 3+, and the “2+” group included scores of 2+ and 3+. The proportional hazards model was utilized to determine the prognostic importance of the tissue biomarkers in predicting OS and PFS adjusting for the treatment arm and the stratification factors (histologic type and MSKCC risk groups). The association of each biomarker with OS and PFS was summarized with a hazard ratio (HR) and 95% confidence interval (CI) for this exploratory analysis, while p-values were adjusted for multiplicity using the false discovery rate (FDR) of 0.056, and we considered FDR<0.1 to be statistically significant. Additionally, the proportional hazards model was used to test for each of the tissue biomarker-treatment interaction terms in predicting OS and PFS. The Kaplan-Meier approach was used to estimate the OS and PFS distributions.
When assessing the association of the biomarkers with histologic subtype, we classified all papillary tumors, including types I and II, as “papillary.” Chromophobe tumors were designated “chromophobe,” and the remaining 30 patients fell into the “undifferentiated” category. Patients with an MSKCC risk score of 0 were classified as having “good” risk, while patients who had MSKCC risk scores of either 1 or 2 were assigned to the “intermediate” group, and those with a score of 3 or above were categorized as “poor.”
Furthermore, logistic regression analysis was used to test for the prognostic importance of the tissue biomarkers in predicting objective response rate. Odds ratios (OR) and 95% confidence intervals (CI) summarized these findings. The final statistical analysis plan was approved by the Duke IRB on August 14, 2014. All analyses were performed using R version 3.5.3 and were adjusted for multiplicity using the false discovery rate (FDR) in determining whether any of tissue biomarkers were prognostic or predictive of OS or PFS.
This Investigator initiated/sponsored trial was supported by funding from Novartis and Pfizer.
ACKNOWLEDGEMENT
We wish to acknowledge the trial
coordinators and their staff for their
support in the conduct of this trial, and
the patients and their families for their
dedication to this research. We wish to
thank Drs. Omar Din at Cancer Clinical
Trial Centre, Weston Park Hospital,
Sheffield, UK and Mary MacKenzie
at London Health Sciences Center,
London Ontario for their support of this
study at their centers. We wish to thank
the Duke Center for Human Genetics
biorepository and David Layfield for
their support and the Duke Clinical
Research Institute (DCRI) for statistical
support. We thank the Cancer Research
UK Clinical Trials Unit, Glasgow who
were instrumental in delivering the
UK sites for this study. We thank both
Novartis and Pfizer for their financial
support of this investigator initiated
trial to both inVentiv Health Clinical
and Ergomed for their monitoring
and data collection support across all
centers. We acknowledge support from
the NIH/NCI for institutional support
in the form of grant P30 CA014236
which supported core resources for
the conduct of the clinical trial and the
Duke Cancer Institute’s Biorepository
and Precision Pathology shared
resource.
AUTHOR CONTRIBUTIONS
AJA: literature search, figures, study
design, data analysis and interpretation,
writing;
SH: data analysis and interpretation,
study design, figures, writing;
QY, SZ, AC: data analysis and
interpretation, figures, writing
TE, WMS, RJJ, JAG, UNV, JP, REH,
JDH, CKK, TFL, IP, LMP, CWR,
AP: data collection, analysis, and
interpretation, writing;
WCF: data collection and analysis,
writing;
DJG: literature search, figures, study
design, data analysis and interpretation,
writing.
Conflicts of Interest
Drs. Armstrong and George reports grants to fund the ASPEN study (to Duke) from Novartis and Pfizer during the conduct of the study. Dr. Armstrong additionally reports grants (to Duke) from Amgen, Forma, Celgene/BMS, Merck, Genentech/Roche, Constellation, Dendreon, Sanofi Aventis, Astra Zeneca, and Beigene. Dr. Armstrong reports consulting income from BMS, Merck, AstraZeneca, Dendreon, Astellas, Pfizer, Janssen, Forma, Bayer, and Exelixis. Dr. George additionally reports grants to Duke from Innocrin, Janssen, Dendreon, Bayer, Medivation/Astellas, and Pfizer and Exelixis and personal fees from BMS and Janssen, Dendreon, Exelixis, Pfizer, and Bayer.
Dr. Eisen reports employment with AstraZeneca (to March 2020) then Roche research support grants from AstraZeneca, Bayer, Pfizer, and stock with AstraZeneca, Roche. Dr. Garcia reports grants and personal fees from Pfizer, grants and personal fees from Novartis, during the conduct of the study; grants and personal fees from Pfizer, grants and personal fees from Novartis, grants and personal fees from Bayer, grants and personal fees from Medivation/Astellas, personal fees from Sanofi, outside the submitted work. Dr. Logan reports grants from Novartis, grants from Pfizer, during the conduct of the study; grants from Abbott, grants from Abraxis, grants from Acceleron, grants from Amgen, grants and personal fees from Argos, grants from AstraZeneca, grants and personal fees from Aveo, grants from Biovex, grants and personal fees from Bristol-Myers Squibb, grants from Cerulean, grants and personal fees from Celgene, grants from Eisai, grants from Eli Lilly, grants and personal fees from GlaxoSmithKline, personal fees from Genentech, grants from Hoffman-LaRoche, grants from Immatics, grants from Merck, grants and personal fees from Novartis, grants and personal fees from Pfizer, grants and personal fees from Prometheus, grants from Roche, grants from Synta, grants from Threshold, grants from Tracon, grants from EMD Serono, grants from Millenium, grants and personal fees from Wyeth, grants from Schering-Plough, outside the submitted work. Dr. Kollmannsberger reports personal fees from Pfizer, personal fees from Novartis, personal fees from BMS, personal fees from Sanofi, outside the submitted work. Dr. Vaishampayan reports grants from Merck, BMS, and Astellas and personal fees from Pfizer, Bayer, BMS, Merck, Exelixis, AAA and Alkermes outside the submitted work. Dr. Ryan reports personal fees from Pfizer, personal fees from Genentech, from Onyx, outside the submitted work. Dr. Jones reports grants from Pfizer, grants from Novartis, during the conduct of the study; grants and personal fees from Pfizer, grants, personal fees and non-financial support from Novartis, grants, personal fees and non-financial support from GSK, outside the submitted work. Dr. Stadler reports grants and personal fees from Pfizer, outside the submitted work. Dr. Pickering reports personal fees from Pfizer and Novartis. The other authors have nothing to disclose.
REFERENCES
1. Shuch B, Amin A, Armstrong AJ,
et al. Understanding pathologic variants of
renal cell carcinoma: distilling therapeutic
opportunities from biologic complexity. Eur
Urol. Jan 2015;67(1):85-97. doi:10.1016/j.
eururo.2014.04.029
2. Bitting RL, Madden J, Armstrong
AJ. Therapy for non-clear cell histologies
in renal cancer. Current clinical
pharmacology. Aug 2011;6(3):169-80.
3. Armstrong AJ, Halabi S, Eisen
T, et al. Everolimus versus sunitinib for
patients with metastatic non-clear cell renal
cell carcinoma (ASPEN): a multicentre,
open-label, randomised phase 2 trial.
Lancet Oncol. Mar 2016;17(3):378-388.
doi:10.1016/S1470-2045(15)00515-X
4. Tannir NM, Jonasch E, Albiges
L, et al. Everolimus Versus Sunitinib
Prospective Evaluation in Metastatic Non-
Clear Cell Renal Cell Carcinoma (ESPN): A
Randomized Multicenter Phase 2 Trial. Eur
Urol. May 2016;69(5):866-74. doi:10.1016/j.
eururo.2015.10.049
5. Armstrong AJ, Nixon AB,
Carmack A, et al. Angiokines Associated
with Targeted Therapy Outcomes in
Patients with Non-Clear Cell Renal Cell
Carcinoma. Clin Cancer Res. Jun 15
2021;27(12):3317-3328. doi:10.1158/1078-
0432.CCR-20-4504
6. Dutcher JP, Szczylik C, Tannir N,
et al. Correlation of survival with tumor
histology, age, and prognostic risk group for
previously untreated patients with advanced
renal cell carcinoma (adv RCC) receiving
temsirolimus (TEMSR) or interferon-alpha
(IFN). ASCO Meeting Abstracts. 6/20/2007
2007;25(18_suppl):5033. Not in File.
7. Bi K, He MX, Bakouny Z, et
al. Tumor and immune reprogramming
during immunotherapy in advanced
renal cell carcinoma. Cancer Cell. May
10 2021;39(5):649-661 e5. doi:10.1016/j.
ccell.2021.02.015
8. Motzer RJ, Banchereau R, Hamidi
H, et al. Molecular Subsets in Renal Cancer
Determine Outcome to Checkpoint and
Angiogenesis Blockade. Cancer Cell. Dec
14 2020;38(6):803-817 e4. doi:10.1016/j.
ccell.2020.10.011
9. Voss MH, Chen D, Marker M, et al.
Circulating biomarkers and outcome from
a randomised phase II trial of sunitinib
vs everolimus for patients with metastatic
renal cell carcinoma. Br J Cancer. Mar 15
2016;114(6):642-9. doi:10.1038/bjc.2016.21
10. Choueiri TK, Heng DYC, Lee JL,
et al. Efficacy of Savolitinib vs Sunitinib
in Patients With MET-Driven Papillary
Renal Cell Carcinoma: The SAVOIR Phase
3 Randomized Clinical Trial. JAMA Oncol.
Aug 1 2020;6(8):1247-1255. doi:10.1001/
jamaoncol.2020.2218
11. Pal SK, Tangen C, Thompson IM,
Jr., et al. A comparison of sunitinib with
cabozantinib, crizotinib, and savolitinib
for treatment of advanced papillary
renal cell carcinoma: a randomised,
open-label, phase 2 trial. Lancet. Feb 20
2021;397(10275):695-703. doi:10.1016/
S0140-6736(21)00152-5
12. Motzer RJ, Bacik J, Mariani T,
Russo P, Mazumdar M, Reuter V. Treatment
outcome and survival associated with
metastatic renal cell carcinoma of nonclear-
cell histology. J Clin Oncol. 5/1/2002
2002;20(9):2376-2381. Not in File.
13. Motzer RJ, Mazumdar M, Bacik J,
Berg W, Amsterdam A, Ferrara J. Survival
and prognostic stratification of 670 patients
with advanced renal cell carcinoma.
JClinOncol. 8/1999 1999;17(8):2530-2540.
Not in File.
14. Baba M, Hong SB, Sharma N, et
al. Folliculin encoded by the BHD gene
interacts with a binding protein, FNIP1, and
AMPK, and is involved in AMPK and mTOR
signaling. Proceedings of the National
Academy of Sciences of the United States
of America. Oct 17 2006;103(42):15552-7.
doi:10.1073/pnas.0603781103
15. Albiges L, Guegan J, Le Formal
A, et al. MET is a potential target across all
papillary renal cell carcinomas: result from
a large molecular study of pRCC with CGH
array and matching gene expression array.
Clin Cancer Res. Jul 1 2014;20(13):3411-21.
doi:10.1158/1078-0432.CCR-13-2173
16. Armstrong AJ, Nixon AB,
Carmack A, et al. Correction: Angiokines
Associated with Outcomes after Sunitinib
or Everolimus Treatment in Patients with
Non-Clear Cell Renal Cell Carcinoma.
Clin Cancer Res. Jun 15 2021;27(12):3503.
doi:10.1158/1078-0432.CCR-21-1636
17. Davis CF, Ricketts CJ, Wang
M, et al. The somatic genomic landscape
of chromophobe renal cell carcinoma.
Cancer Cell. Sep 8 2014;26(3):319-330.
doi:10.1016/j.ccr.2014.07.014
18. Carlo MI, Khan N, Zehir A, et
al. Comprehensive Genomic Analysis of
Metastatic Non-Clear-Cell Renal Cell
Carcinoma to Identify Therapeutic Targets.
JCO Precis Oncol. 2019;3doi:10.1200/
PO.18.00372
* Corresponding Author: Andrew J. Armstrong, MD ScM FACP
Professor of Medicine, Surgery, Pharmacology and Cancer Biology
Director of Research, Duke Cancer Institute Center for Prostate and Urologic Cancers
DUMC Box 103861, Durham NC 27710 USA. Email: andrew.armstrong@duke.edu